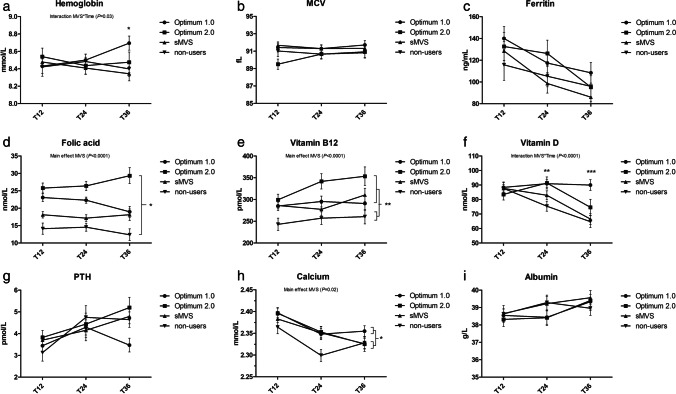
Fig. 2.
Serum concentrations for all groups after the 12-month intervention period (T12), and at 24 and 36 months of follow-up (T24, T36). Lines depict estimated marginal means ± standard errors (error bars). a Hemoglobin. *Significantly higher serum levels for Optimum 1.0 compared to sMVS and non-users at T36 (P < 0.05). b MCV. c Ferritin. d Folic acid. *Significantly different serum levels between all groups (P < 0.05). e Vitamin B12. **Significantly lower serum levels for non-users compared to all other groups (P < 0.01). f Vitamin D. **Significantly higher serum levels for Optimum 1.0 and Optimum 2.0 compared to non-users at T24 (P < 0.01). ***Significantly higher serum levels for Optimum 1.0 compared to non-users and sMVS at T36 (P < 0.001). g PTH. h (Corrected) calcium. *Significantly higher serum levels for Optimum 1.0 compared to non-users (P = 0.02). i Albumin

