Figure 2:

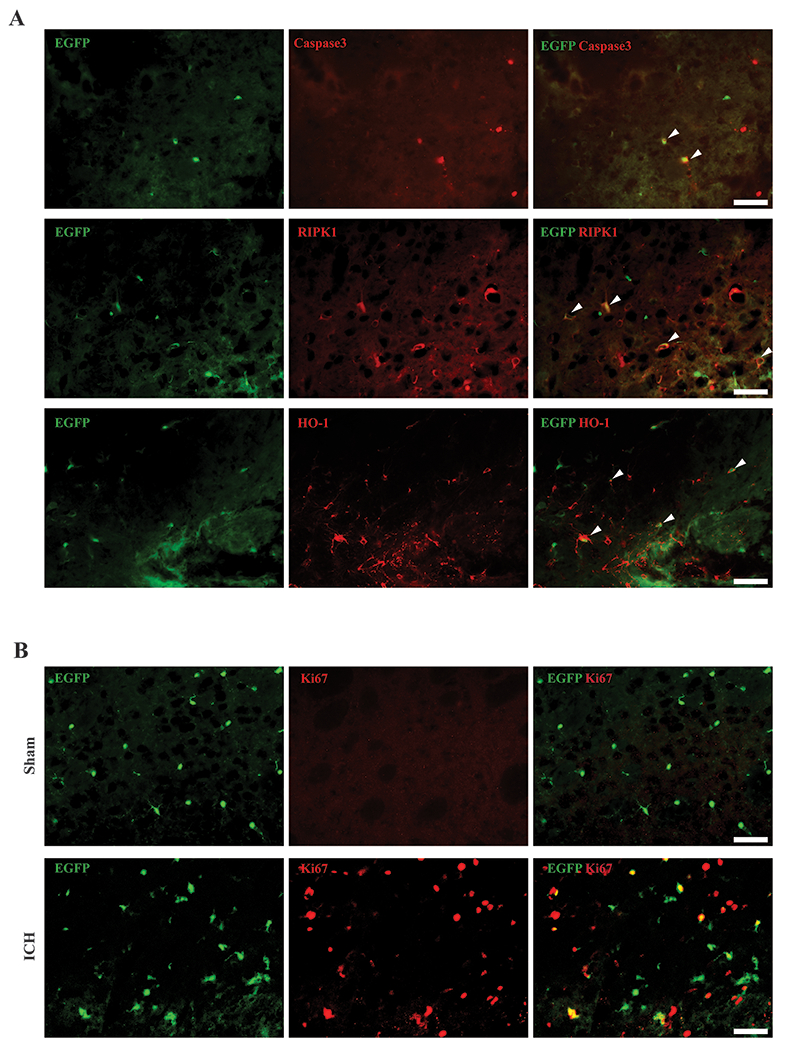
Microglia colocalized with cell death/stress markers and Ki67. (A) Representative cleaved caspase 3 (red), RIPK1 (red), and HO-1 (red) immunoreactivity colocalized with Tmem119-EGFP (green) 1 day after ICH. Arrowheads indicate double positive cells. (B) Representative fluorescence images of Ki67 immunoreactivity colocalization with Tmem119-EGFP in sham and 3 days after ICH. Scale bars are 50μm.
