
Figure 4: mAChR-B overexpression decreases odor responses only in γ KC axons.
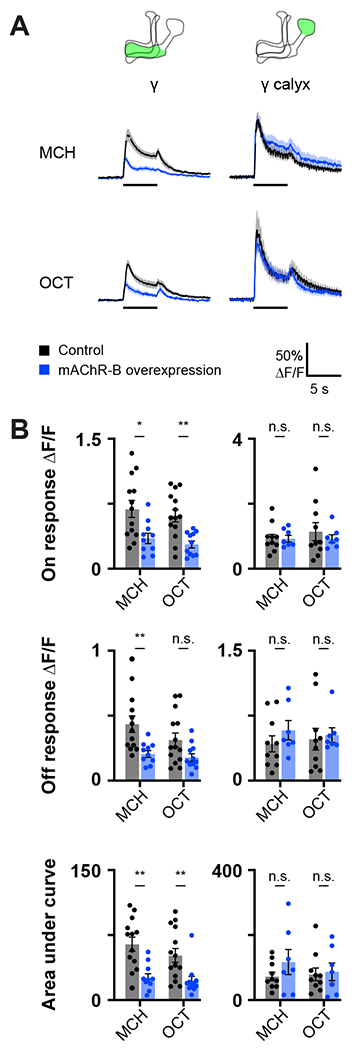
Odor responses to MCH and OCT were measured in control flies (R71G10-GAL4>UAS-GCaMP6f) and overexpression flies (R71G10-GAL4>UAS-GCaMP6f, UAS-mAChR-B).
A. ΔF/F of GCaMP6f signal in the calyx and lobe of γ KCs for control (black) and overexpression (blue) flies, during presentation of odor pulses (horizontal lines). Data are mean (solid line) ± SEM (shaded area). Diagrams illustrate which region of the MB was analyzed.
B. Peak “on” response (top), Peak “off” response (middle), and the integral of the odor response (bottom) of the traces presented in A (mean ± SEM). Only in γ KC axons a significant decrease in odor responses is observed. This decrease was observed for both odors and in all modes of analysis. n for control MCH, OCT and overexpression MCH, OCT flies, respectively: γ, 14, 13,10, 11; γ calyx, 10, 10, 7, 7. * p < 0.05, ** p < 0.01, (Mann-Whitney test with Holm šídák correction for multiple comparisons). For detailed statistical analysis see Table S1.