
Figure 5: mAChR-B decreases cAMP level.
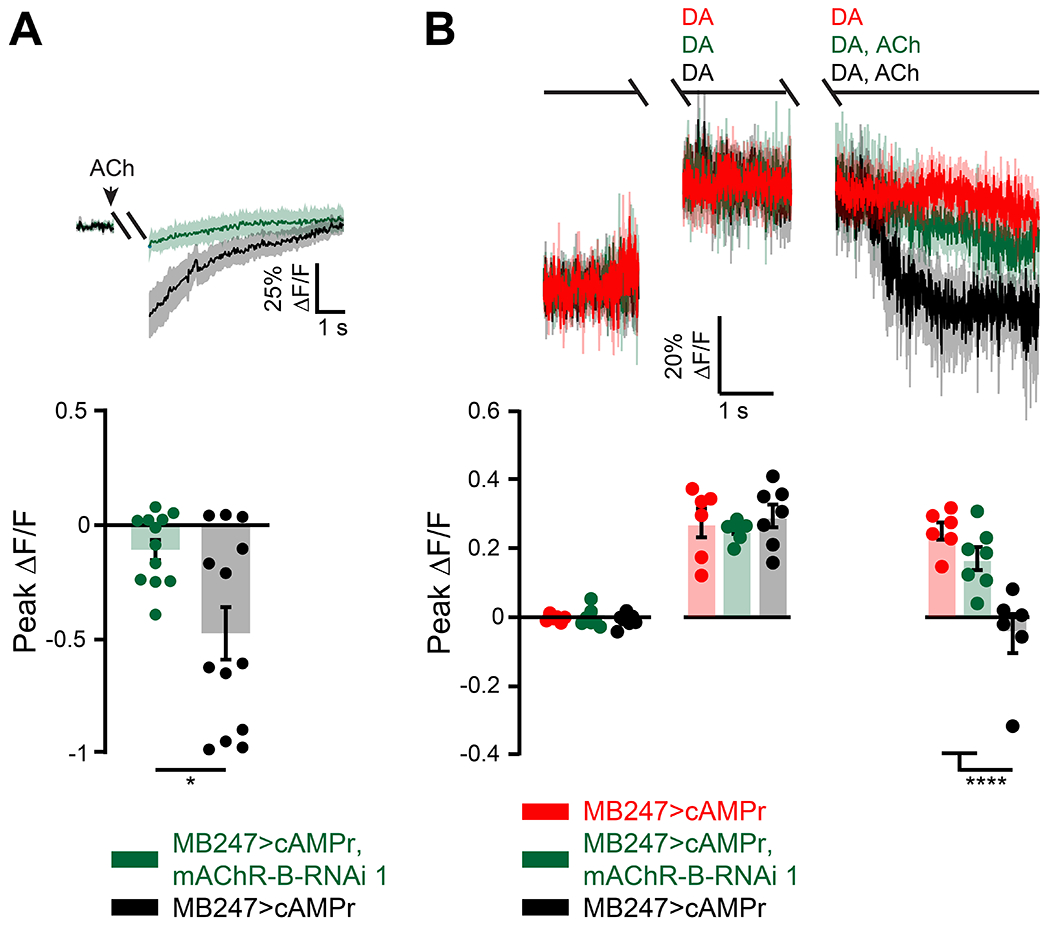
cAMP level was measured using the single-wavelength fluorescent sensor for cyclic AMP, UAS-cAMPr. MB247-GAL was used to drive expression.
A. Top, ΔF/F of cAMPr following activation of mAChR-B using a 2 s puff (gap) of 1mM ACh (black). To abolish any circuit effects 1 μM TTX was bath applied. KD of mAChR-B using UAS-mAChR-B RNAi 1 (green) abolished the decrease in cAMP, indicating that the observed cAMP decrease indeed arises from mAChR-B activation. Data are mean (solid line) ± SEM (shaded area). Bottom, Peak response of the top presented traces (mean ± SEM). n for wt and KD flies respectively, 13, 12; * p < 0.05, (Mann-Whitney two-tailed rank test). For detailed statistical analysis see Table S1.
B. Top, ΔF/F of cAMPr. Application of 5 mM DA resulted in sustained increase in cAMP levels (red). The 2 s gap is when a puff of DA was given and either DA or ACh and DA together was given. Activation of mAChR-B using a puff of 0.5 mM ACh (black) significantly decreased cAMP levels to the initial level. To abolish any circuit effects 1 μM TTX was bath applied. KD of mAChR-B using UAS-mAChR-B RNAi 1 (green) resulted in almost no decrease of cAMP indicating that the observed cAMP decrease indeed arises from mAChR-B activation. Data are mean (solid line) ± SEM (shaded area).
Bottom, Peak response of the top presented traces (mean ± SEM). n for DA alone, DA with mAChR-B activation, and for KD flies respectively, 7, 6, 7; **** p < 0.0001, (Shapiro-Wilk normality test, followed by two-way ANOVA with Tukey’s correction for multiple comparisons). For detailed statistical analysis see Table S1.