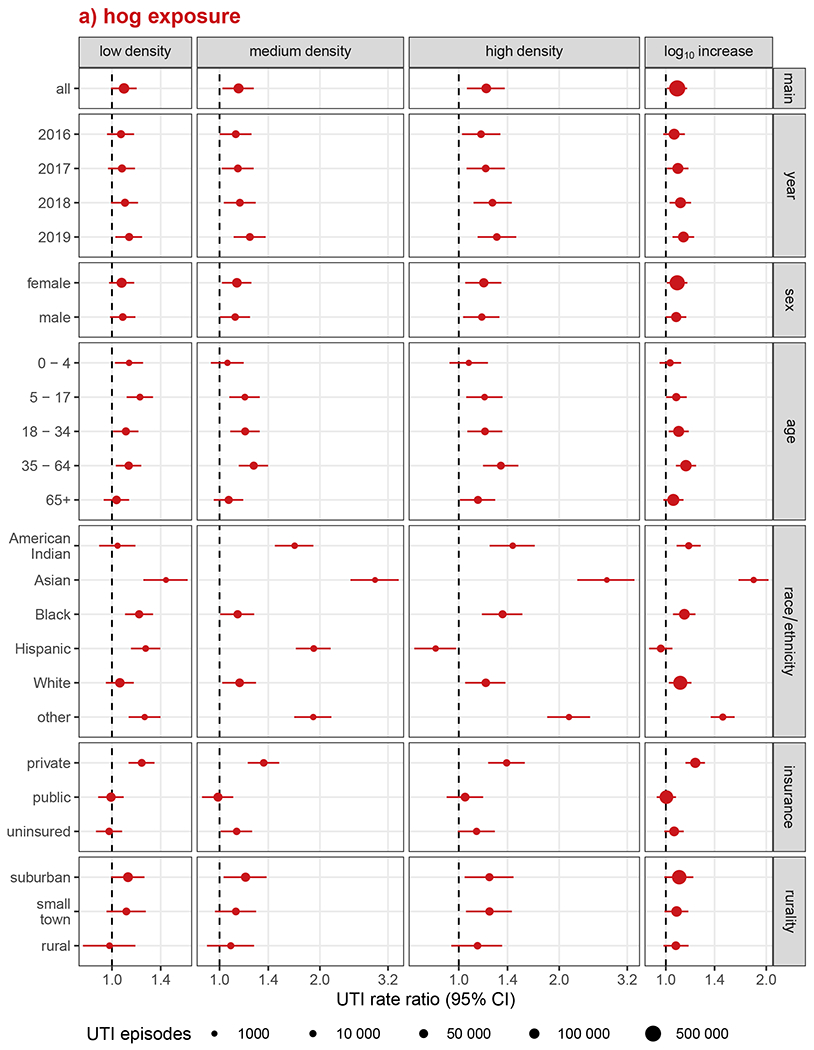
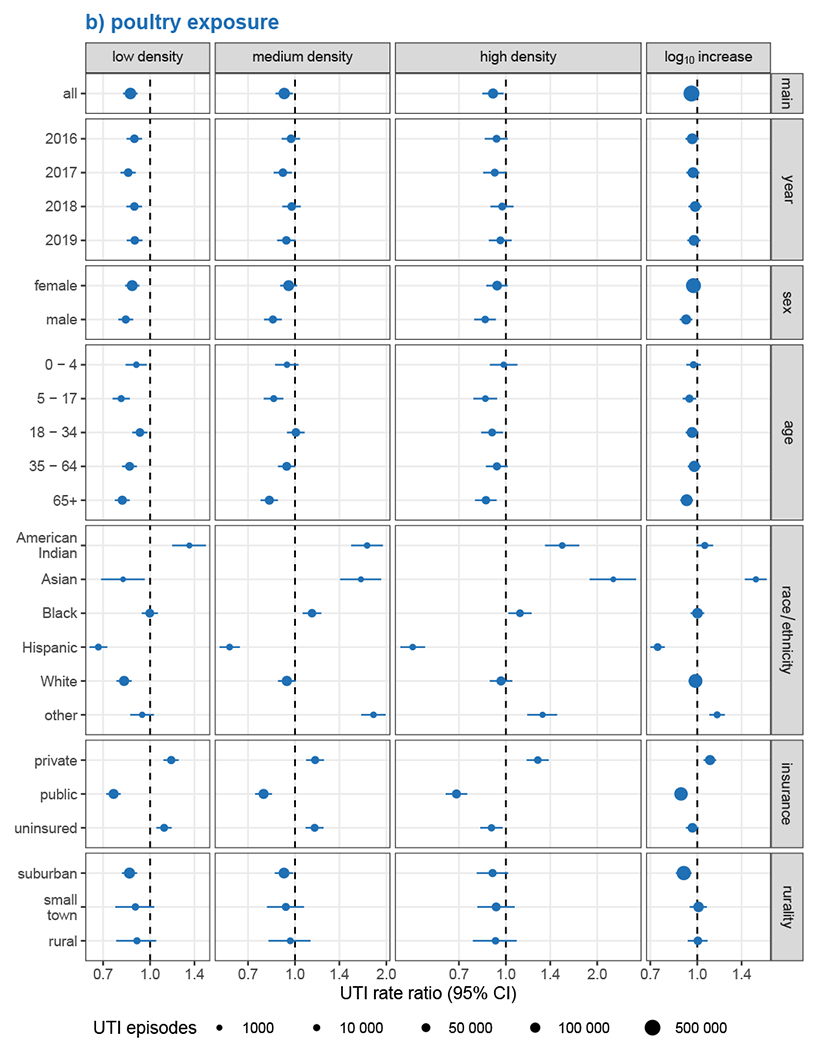
Figure 3.


Analysis of effect measure modification of UTI incidence associations with a) hog exposure and b) poultry exposure, by calendar year, sex, age, race/ethnicity, health insurance, and rurality. Modification was assessed on the multiplicative scale in single-animal models using product-term interactions between exposure group and the effect measure modifier and rate ratios as the measure of effect. Low, medium, and high exposure categories correspond to tertiles of non-zero density values, with zero-density ZIP codes serving as the reference group. Race and ethnicity were collapsed into a single variable with Hispanic individuals of any race forming one group and non-Hispanic individuals forming groups according to their recorded race. Models were adjusted for ZIP code isolation score, median household income, and percent lacking health insurance, except for models of EMM by rurality, which were not adjusted for isolation score, and EMM by health insurance, which were not adjusted for uninsured population.
