
Figure 2. Correlations between baseline functional connectivity and longitudinal neurodegeneration.
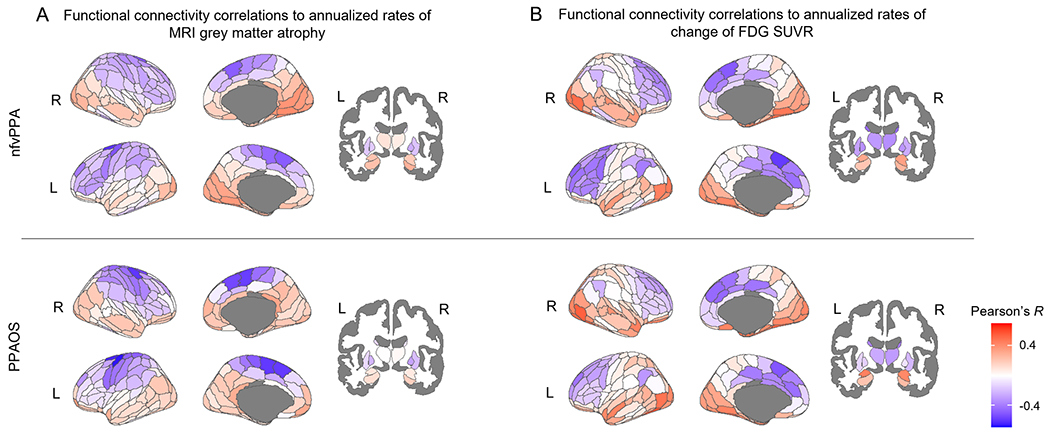
Each region of the Brainnetome atlas is colored-coded based on the Pearson’s R correlation coefficient between group-average functional connectivity from that region and measures of longitudinal rates of atrophy (A) and hypometabolism (B) in nfvPPA and PPAOS. A negative correlation (in blue) indicates that a stronger functional connectivity to the region is associated with faster rates of neurodegeneration across all other connected regions.