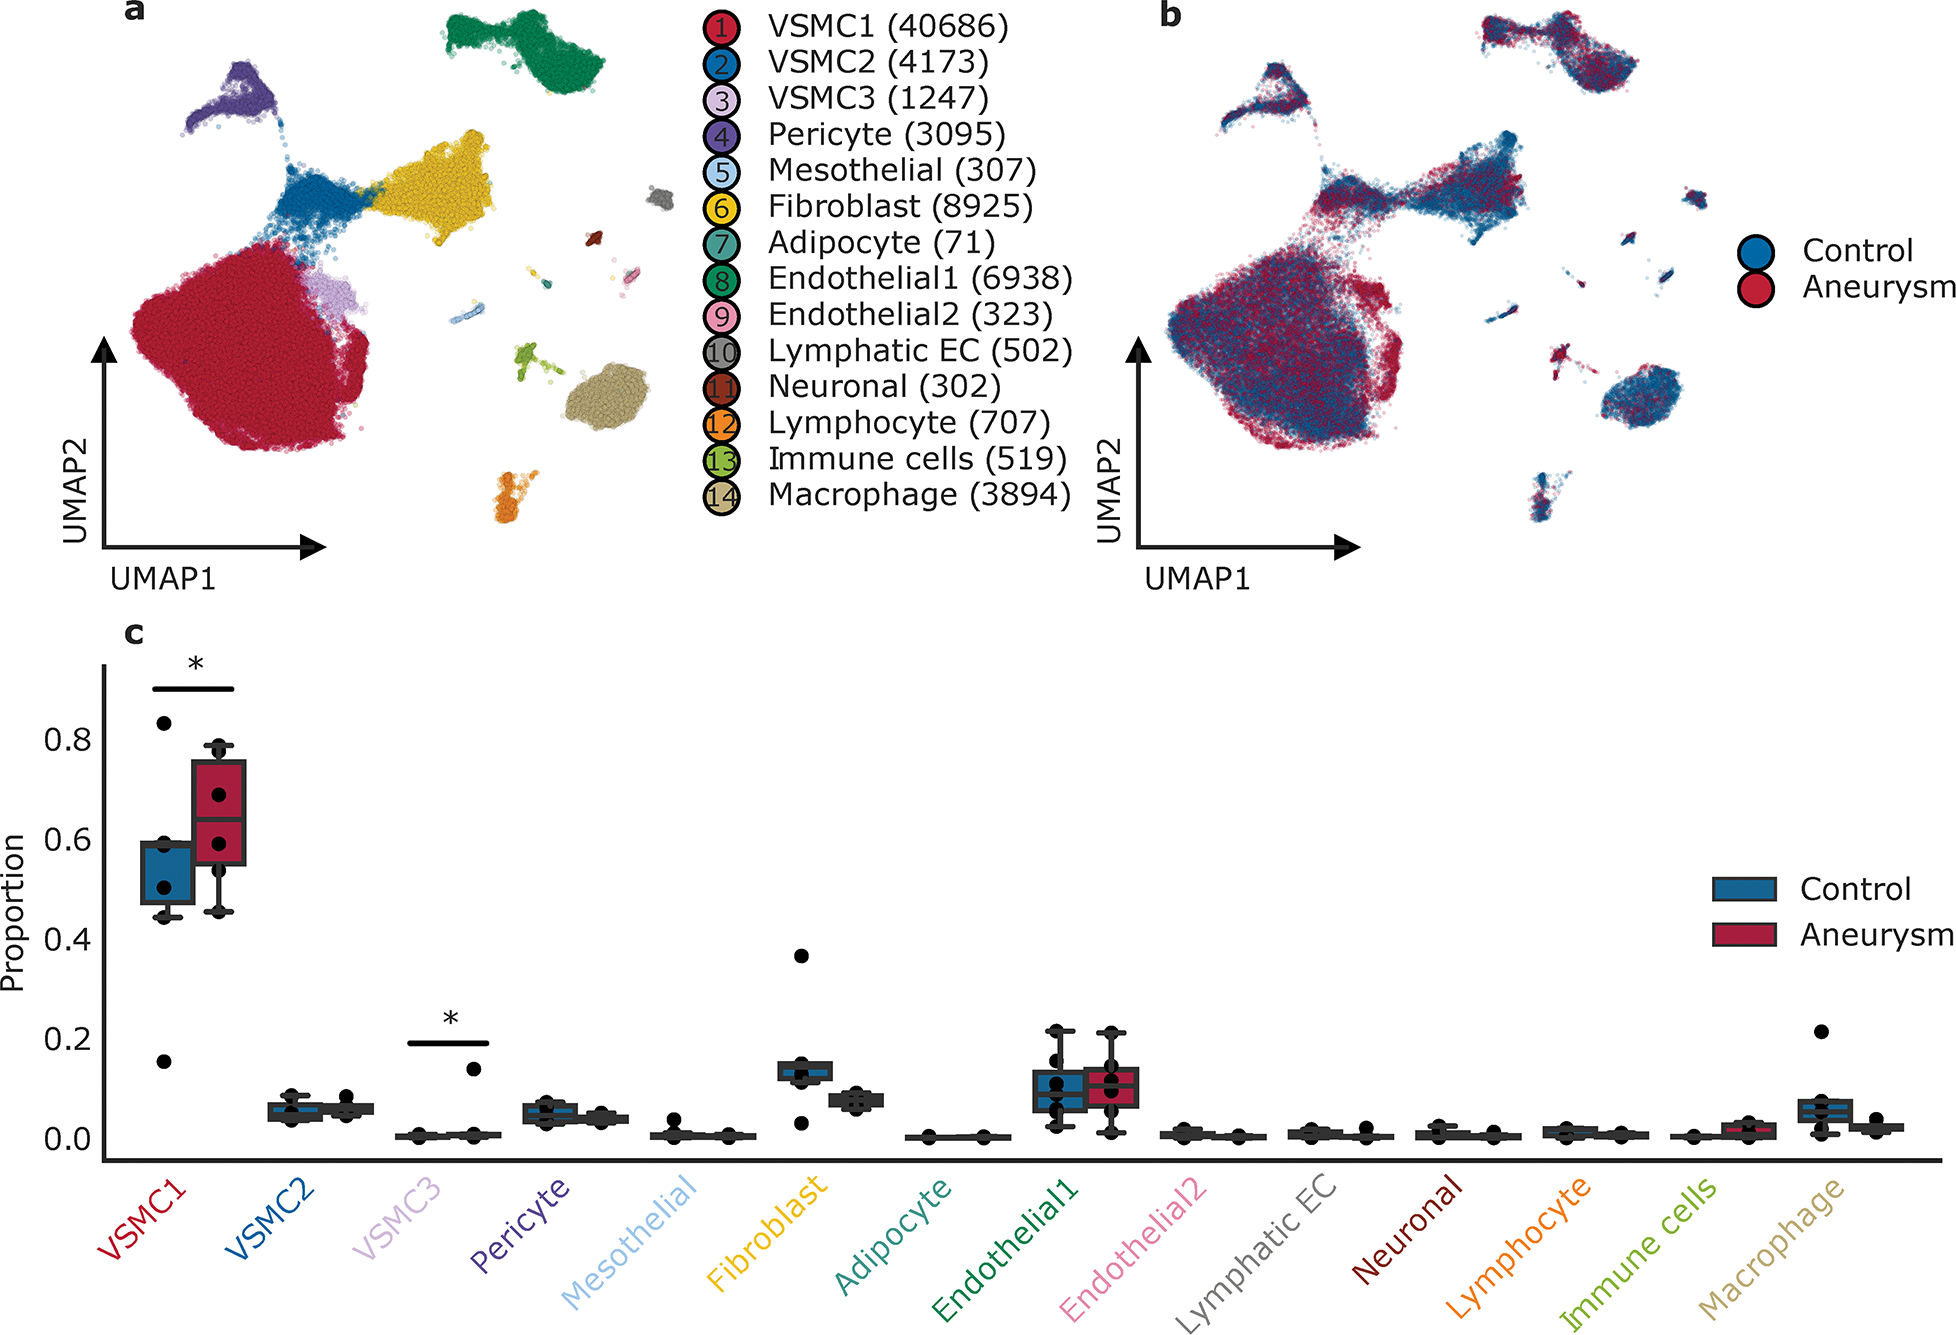
Figure 2. Aortic cell type assignment.

Observed cell types in the ascending aorta. a. Uniform manifold approximation and projection plot displaying cellular diversity across 71,689 nuclei from the ascending aorta of aneurysm and control patients. Each dot represents an individual nucleus. Colors correspond to the cell cluster labels. b. Combined uniform manifold approximation and projection plot contrasting 6 individuals with aneurysm and 7 control aortic samples. Aneurysm nuclei represented in magenta, control aortic nuclei are colored in blue. c. Distribution of cell clusters across individuals, stratified by disease status (aneurysm=6, control=7). Statistically credible shifts in proportions as tested using scCODA (see Methods) are denoted with a *. Center line, median; box limits, upper and lower quartiles; whiskers, 1.5x interquartile range.
