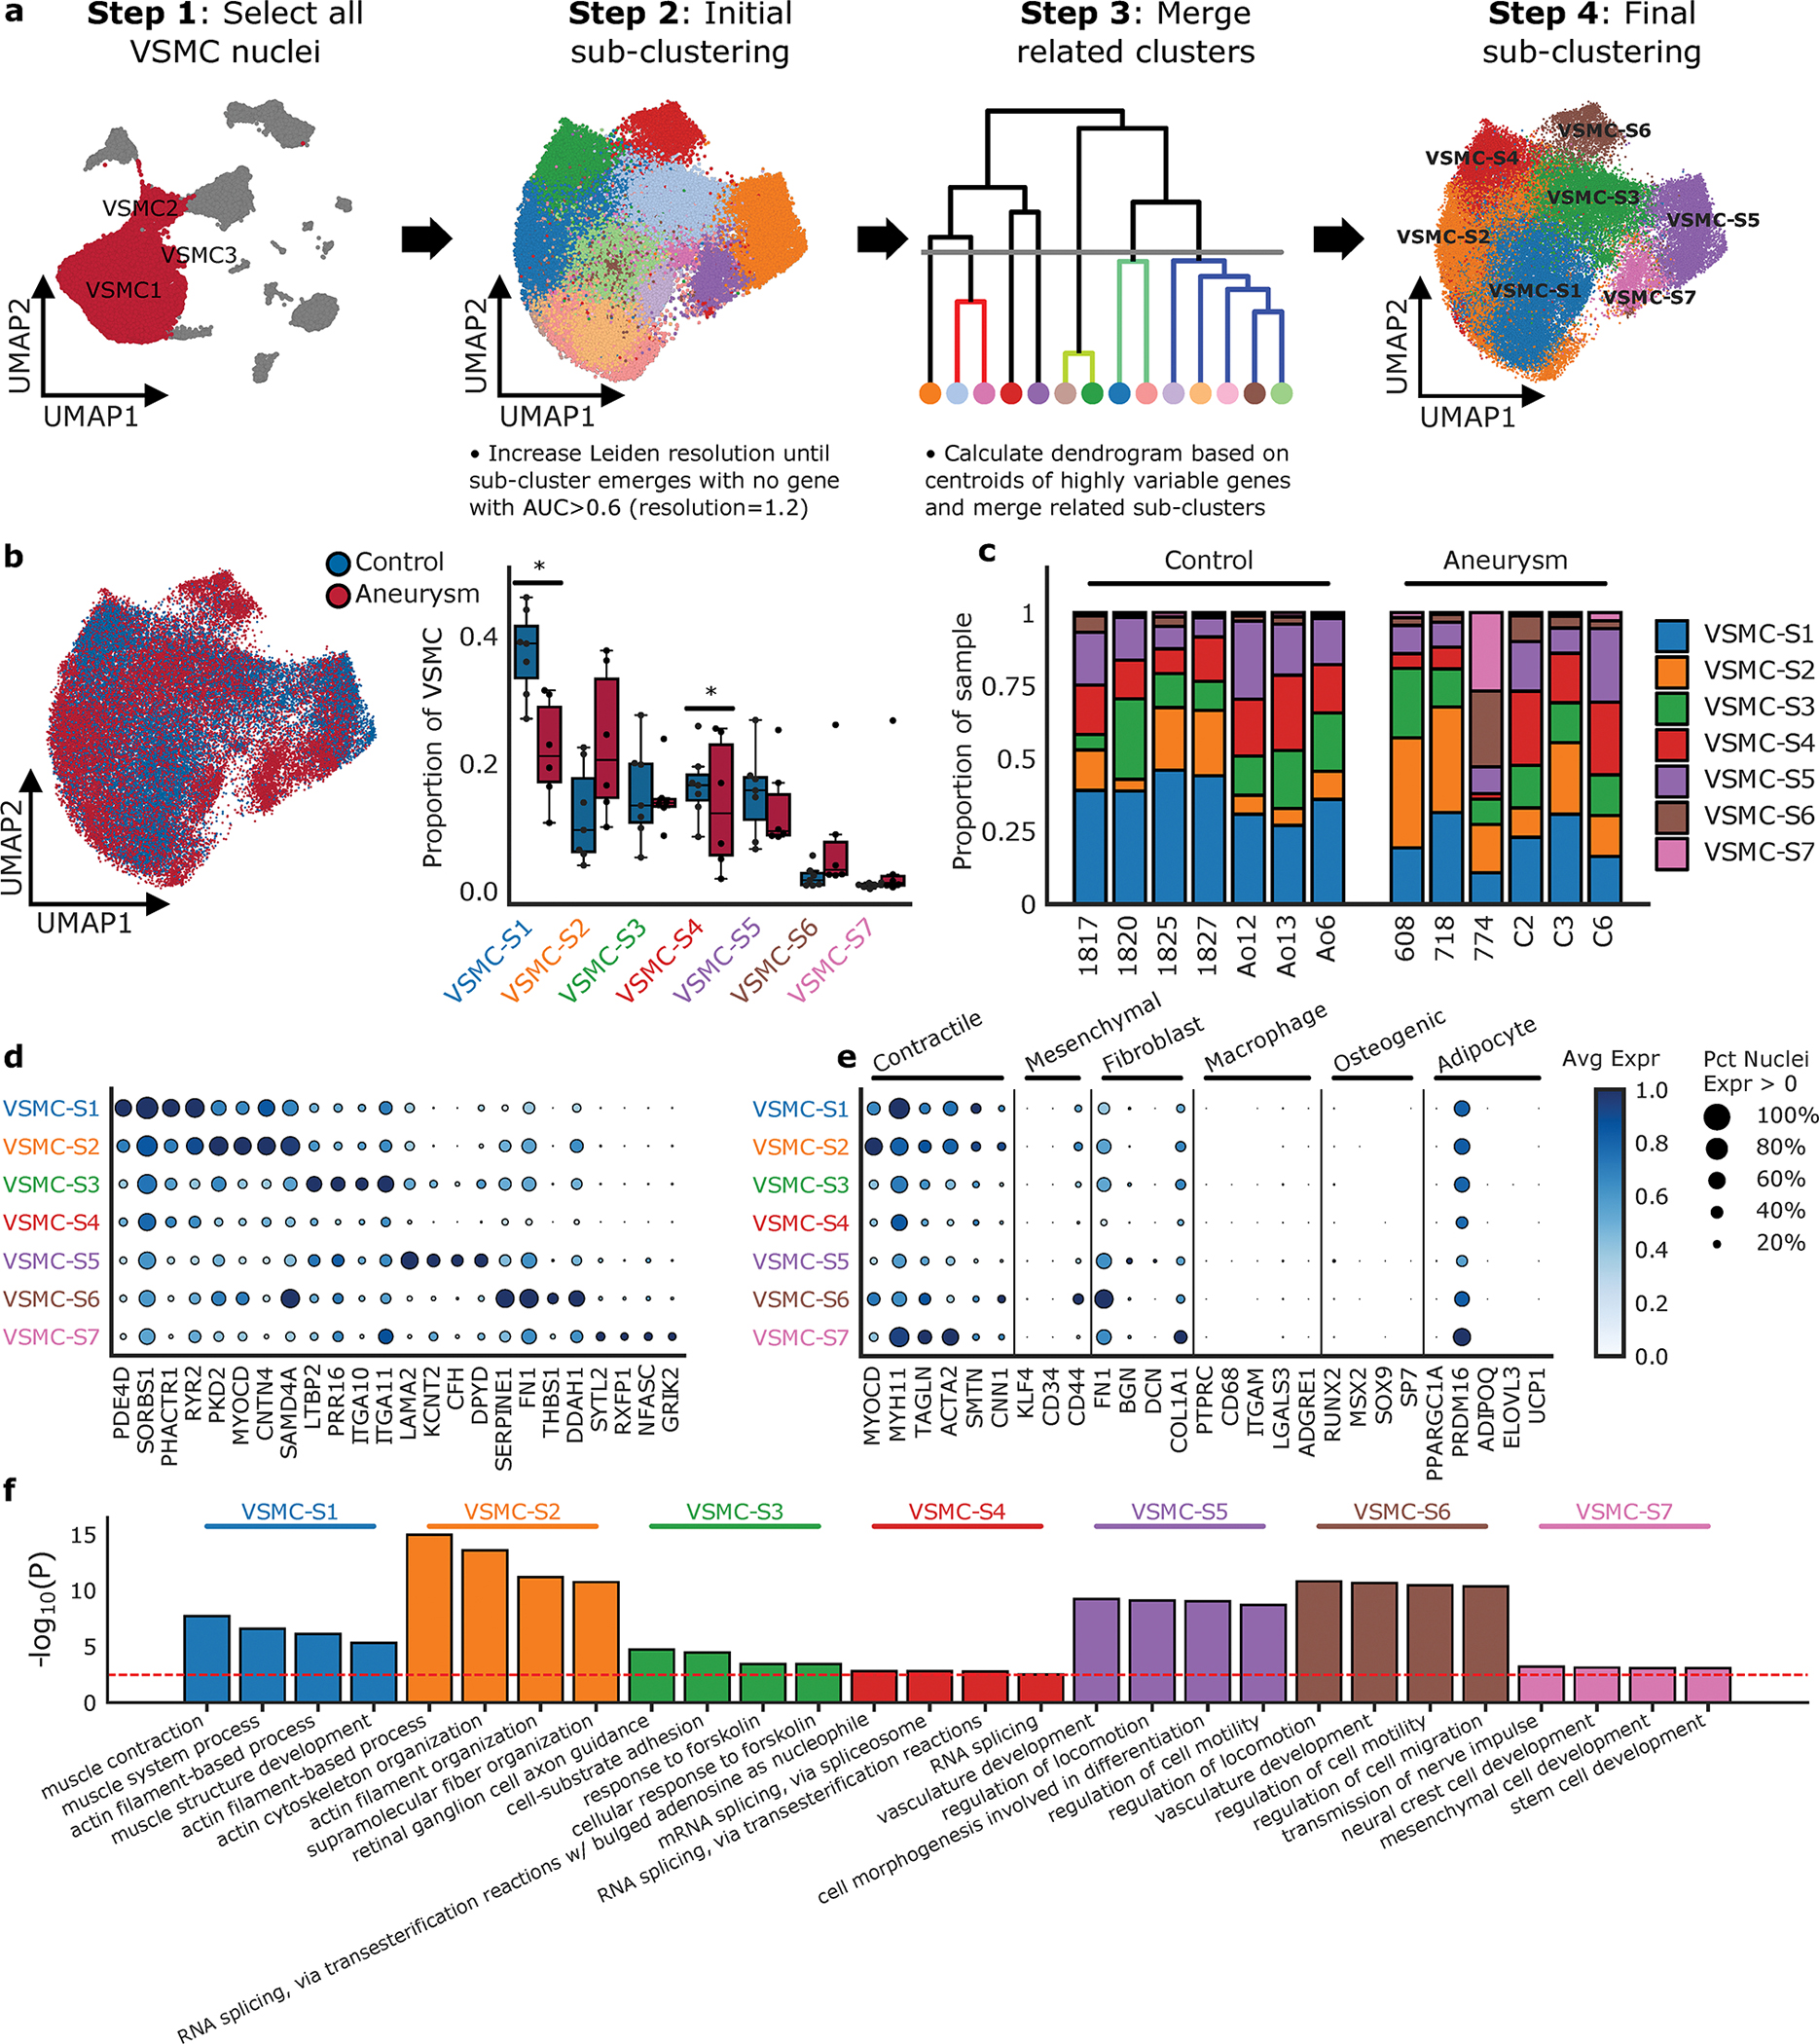
Figure 5. VSMC Cell Subclustering.

a. Subclustering technologic approach; Nuclei clustered as VSMC1, VSMC2, VSMC3 were selected to identify clusters enriched for marker genes of other global cell types. Subcluster methodology includes re-estimation of the top 2000 most highly variable genes and recalculation of the top principal components using log-normalized and scaled expression. Harmonizing the principal components, UMAP construction and Leiden clustering at increasing resolutions until subclusters with no marker genes (AUC > 0.6) compared to all other clusters emerge. Transcriptional similar subclusters are merged to get final sub-clustering results. b. Overlap of aneurysm and control nuclei on VSMC sub-clustering and the relative proportion of each subcluster between control and aneurysmal aortic tissue. Statistically credible shifts in proportions as tested using scCODA (see Methods) are denoted with a *. Center line, median; box limits, upper and lower quartiles; whiskers, 1.5x interquartile range. c. The relative proportion of each subcluster type by sample. d. Selected marker genes that define each subcluster. e. Classic VSMC markers grouped by VSMC phenotype and the expression of each marker in each VSMC subcluster. f. Enrichment analysis of the VSMC subclusters identified significant pathways of interest based on marker genes of the subclusters. The red dotted line represents a Benjamini-Hochberg FDR corrected threshold of 0.05. Avg Expr, Average log-normalized expression scaled to the maximum expression in any sub-cluster; Pct Nuclei Expr > 0, Percent of nuclei in a given sub-cluster that express the gene at non-zero levels.
