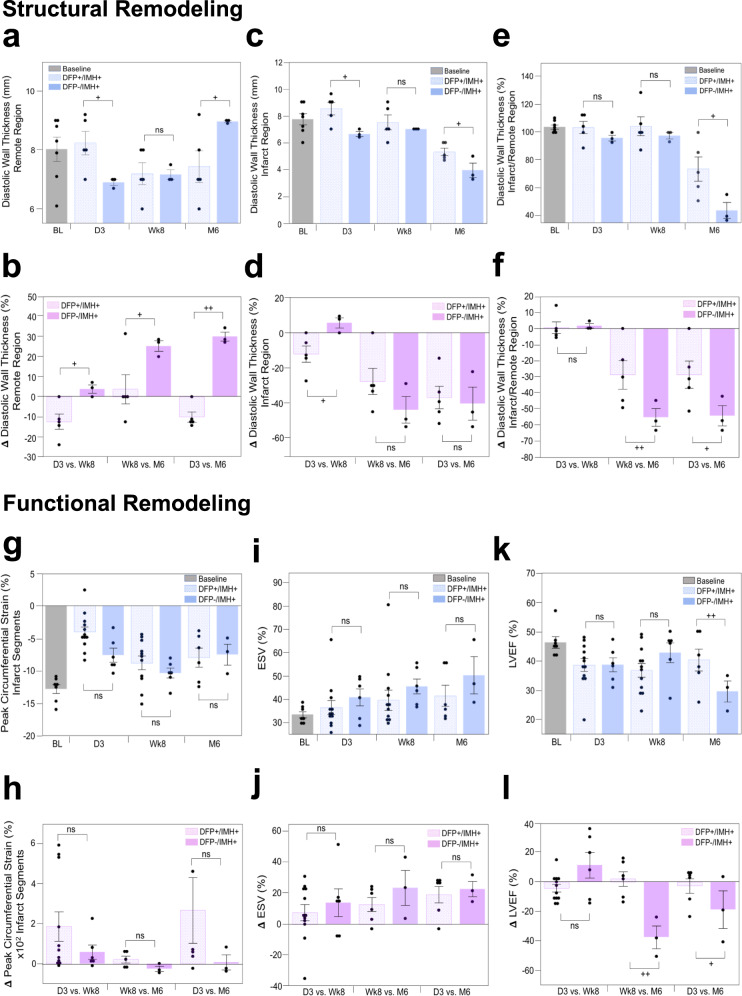
Fig. 10. Orally administered deferiprone significantly improves structural and functional LV remodeling in canine models of hemorrhagic MI.
Structural remodeling: Structural remodeling based on changes in diastolic wall thickness of remote region, MI region, and composite remodeling (indexed as a ratio of infarct/remote wall thickness) in treated (DFP+/IMH+) and untreated (DFP−/IMH+) animals (with matched MI size and iron concentration as determined on LGE and R2* cardiac MRI at day 3 (D3), week 8 (Wk8) and month 6 (M6) are shown in panels a–f. Panels a and c show the absolute values of diastolic wall thickness in the remote and infarct zones at each of the time points, and panel e shows the ratio of wall thickness between infarct and remote segments. Panels b, d, and f show the rate of change in structural indices between D3 to Wk8 (duration over which the DFP+/IMH+ group received DFP treatment, but not the DFP−/IMH+group), Wk8 to M6 (duration over which neither the DFP+/IMH+ nor DFP−/IMH+ groups received any DFP), and D3 to M6 (the full study period). DFP-treated animals demonstrated positive structural remodeling compared to the untreated controls. Evaluable canine CMR data were available in n = 5 (DFP+/IMH+) and n = 3 (DFP−/IMH+) animals at D3, Wk8 and M6. Functional remodeling: The corresponding functional LV remodeling based on changes in peak circumferential strain, end-systolic volume, and LV ejection fraction in the same animals over the same time intervals are shown in panels g–l. Baseline data (BL, acquired prior to MI), is shown for reference. Both structural and functional LV remodeling show more beneficial in DFP+/IMH+group compared to DFP−/IMH+group, which shows adverse remodeling towards heart failure. Additional details are provided in the text. Baseline CMR to gather structural and functional data was performed in n = 7 animals and all images were evaluable. Evaluable canine CMR data were available in n = 12 (DFP+/IMH+) and n = 6 (DFP−/IMH+) animals at D3 and Wk8; and n = 6 (DFP+/IMH+) and n = 3 (DFP−/IMH+) animals at M6. In panels a, c, e, g, i, and k, one-sided Student’s t-test was performed between DFP+/IMH+ and DFP−/IMH+ groups to test significance at each time point (D3, Wk8, and M6). Panel a: p = 0.023 at D3, p = 0.48 at Wk8 and p = 0.04 at M6. Panel c: p = 0.012 at D3, p = 0.26 at Wk8 and p = 0.023 at M6. Panel e: p = 0.13 at D3, p = 0.25 at Wk8 and p = 0.026 at M6. Panel g: p = 0.010 at D3, p = 0.17 at Wk8 and p = 0.42 at M6. Panel i: p = 0.20 at D3, p = 0.19 at Wk8 and p = 0.10 at M6. Panel k: p = 0.49 at D3, p = 0.079 at Wk8 and p = 0.058 at M6. In panels, b, d, f, h, j, l, a one-sided Student’s t-test was performed between DFP+/IMH+ and DFP−/IMH+ groups to test significance at each time period (D3 vs. Wk8, Wk8 vs. M6 and D3 vs. M6). Panel b: p = 0.011 at D3, p = 0.037 at Wk8 and p = 2.1 × 10⁻⁵ at M6. Panel d: p = 0.017 at D3, p = 0.10 at Wk8 and p = 0.38 at M6. Panel f: p = 0.41 at D3, p = 0.040 at Wk8 and p = 0.040 at M6. Panel h: p = 0.12 at D3, p = 0.057 at Wk8 and p = 0.16 at M6. Panel j: p = 0.26 at D3, p = 0.49 at Wk8 and p = 0.25 at M6. Panel l: p = 0.020 at D3, p = 0.0014 at Wk8 and p = 0.096 at M6. +p < 0.05; ++p < 0.001, ns, not significant. The data are shown as mean ± SEM. Source data are provided in the Source Data file.

