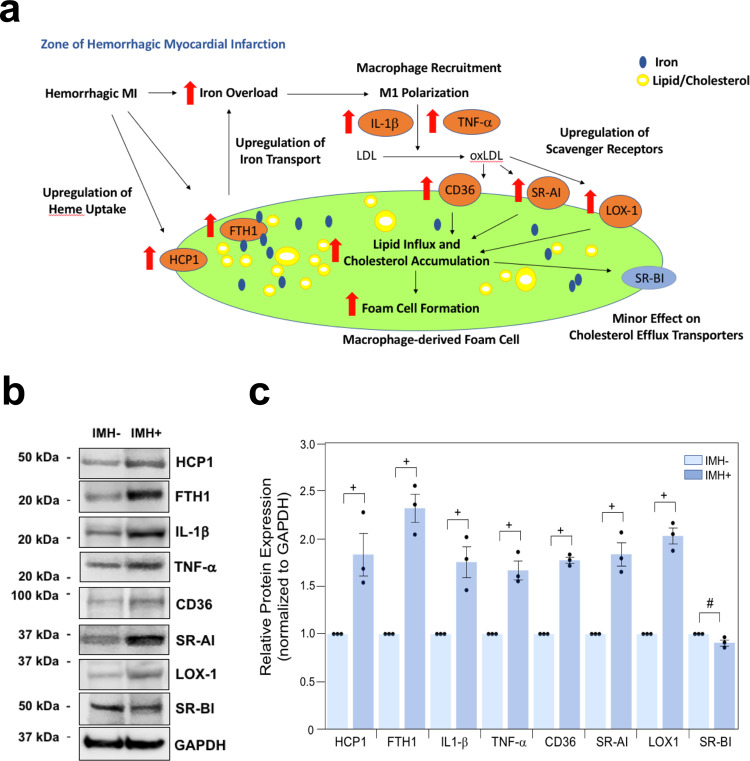
Fig. 8. A proposed scheme of macrophage-derived foam cell formation in the chronic phase of hemorrhagic myocardial infarction.
Panel a: An overload of iron generated from hemorrhage promotes the recruitment of unpolarized macrophages and oxidizes the lipids (low-density lipoprotein, LDL) in its vicinity; and the oxidized lipids (oxidized low-density lipoprotein, oxLDL), iron and heme are taken up by macrophages, which promote their polarization into the pro-inflammatory state through enhanced stimulation of IL-1β and TNF-α and transform them into foam cells through excessive lipid influx and cholesterol accumulation: (1) Most of oxLDL is internalized into cells via upregulation of scavenger receptors (cluster of differentiation of 36, CD36; scavenger receptor type I, SR-AI; oxidized low-density lipoprotein receptor 1, LOX-1); (2) The expression of the cholesterol efflux transporter (scavenger receptor class B type I, SR-BI) is moderately downregulated; (3) The iron and heme are taken up through increased expression of Ferritin Heavy Chain 1, FTH1, and Heme Carrier Protein 1, HCP1. Macrophage-derived foam cells are responsible for intracellular fat deposition in the zone of hemorrhagic myocardial infarction. Panel b: The altered protein expression of factors enhances foam cell formation in hemorrhagic myocardial infarction. Western blot analyses of ex vivo heart explants from regions of hemorrhagic (IMH+) and non-hemorrhagic (IMH−) myocardial infarction with the indicated antibodies. The experiment was repeated independently three times with similar results, and samples from the same experiment were processed in parallel. GAPDH was used as a loading control for all the experiments. Panel c: Quantification of protein signal intensities from immunoblots in b. Densitometric values of the IMH− group of each indicated protein were arbitrarily set equal to 1, and values of the corresponding IMH+ group are normalized to this reference point. The paired one-tailed Student’s t-test was used for comparisons between the two groups. The p-value of IMH− vs. IMH+ for HCP1, FTH1, IL1-β, TNF-α, CD36, SR-AI, LOX1 and SR-BI are: p = 0.03; p = 0.006; p = 0.02; p = 0.01; p = 0.0009; p = 0.01; p = 0.003 and p = 0.05, respectively. The data are shown as mean ± SEM (+p < 0.05; #p = 0.05; n = 3 independent experiments). Source data are provided in the Source Data file.

