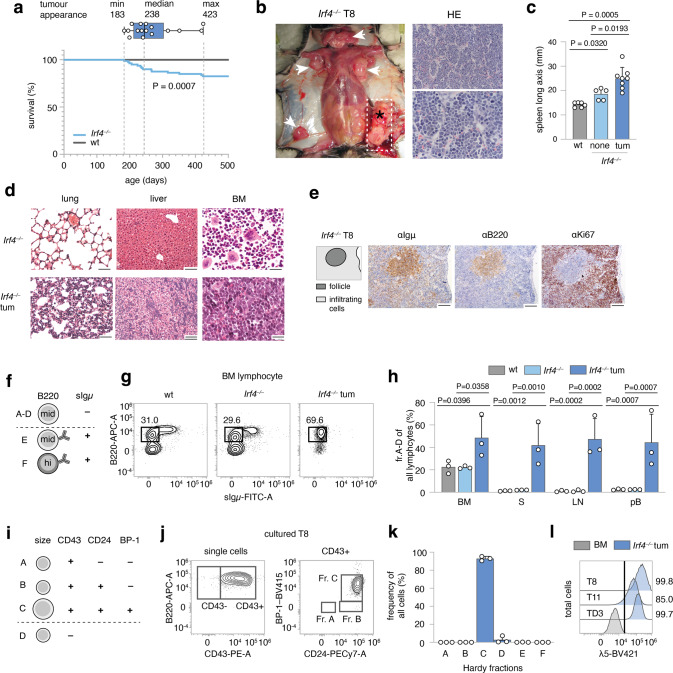
Fig. 1. Spontaneous emergence of preB-I cell BCP-ALL in adult Irf4−/− mice.
a A cohort of 80 Irf4−/− and wt mice was observed over 500 days for tumor development. Kaplan–Meier plot of survival. Box and whisker plot indicates minimum, maximum and median age at tumor appearance of the 14 affected mice. b Macroscopic appearance of an exemplary tumor (asterisk) and LNs (arrowheads) in an Irf4−/− mouse. Right: Hematoxylin-Eosin (HE) staining from the tumor. Scale bars: top: 50 µm, bottom: 20 µm. c Longitudinal spleen (S) axis (mm) of Irf4−/− mice with (n = 8) or without (n = 5) tumor and control wt mice (n = 6). tum = tumor. d HE stainings of lung, liver, and BM of tumor mouse T8 and a healthy Irf4−/− mouse. Scale Bars: 50 µm (lung and liver), 20 µm (BM). e IHC-stainings of T8 mouse spleen for Igμ, B220, and Ki67. Scale bars: 100 µm. f Schematic representation of gross Hardy fractioning by surface B220 and Igμ expression. g Whole BM cells from wt, Irf4−/−, and tumor mice were stained for B220 and sIgμ expression and analyzed by flow cytometry. h Quantification of cell frequencies gated as in (g) for BM, S, LN, and pB (peripheral blood) of n = 3 mice per group. i Tabular representation of Hardy fr. A-D by size, CD43-, CD24-, and BP-1-surface expression. j Surface expression of markers as in (i) of in vitro cultured T8 tumor cells k quantification of cell frequencies gated as in (j) for three tumors (T8, T11, TD3) l surface λ5 expression on T8, T11, and TD3 by flow cytometry in comparison to whole BM cells from Irf4−/− mice (BM) as a negative control. Statistical significance testing was performed with (c) one-way Welch-ANOVA followed by Dunnet’s T3 multiple comparison test and (h) with two-way ANOVA followed by pair-wise Tukey corrected comparisons within each organ. Bars depict mean ± SD, dots indicate mice (h) or distinct Irf4−/− tumors (k).

