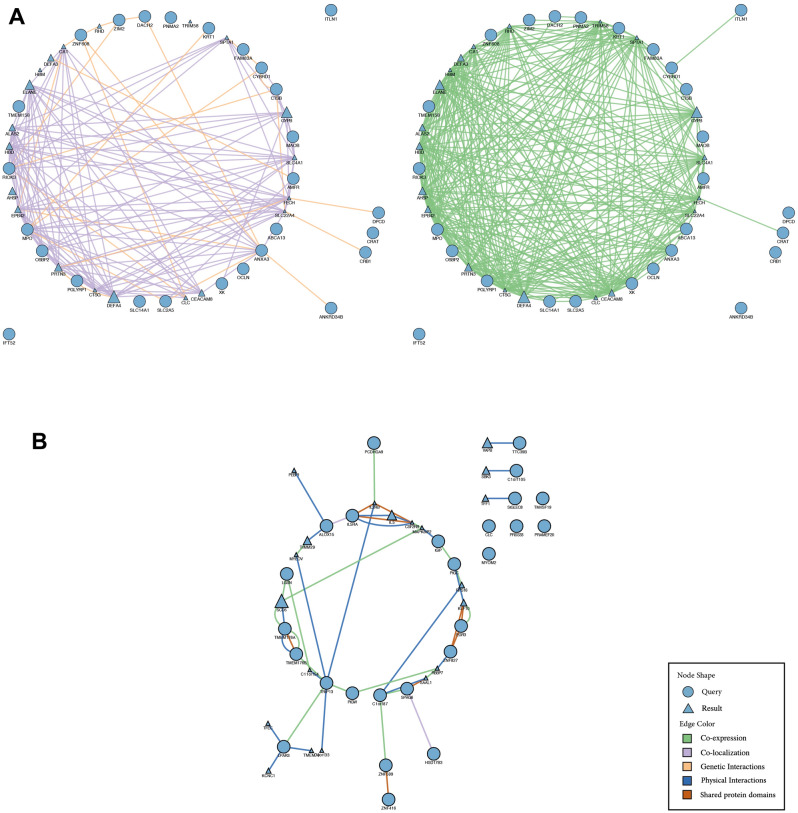
Figure 3.
Candidate genes in BM SCLC patients—gene networks from GeneMANIA. (A) Up-regulated genes network. Physical interactions are shown in blue lines, Co-expression genes are shown in green lines, Co-localization is shown in purple lines and shared protein domains are shown in the orange lines. The higher scores are shown as a larger circle. Intermediate genes involved were also demonstrated. (B) Down-regulated genes network. Co-expression genes are shown in green lines, Co-localization is shown in purple lines, and genetic interactions are shown in orange lines. The higher scores are shown in black as a larger circle. Intermediate genes involved were also demonstrated.

