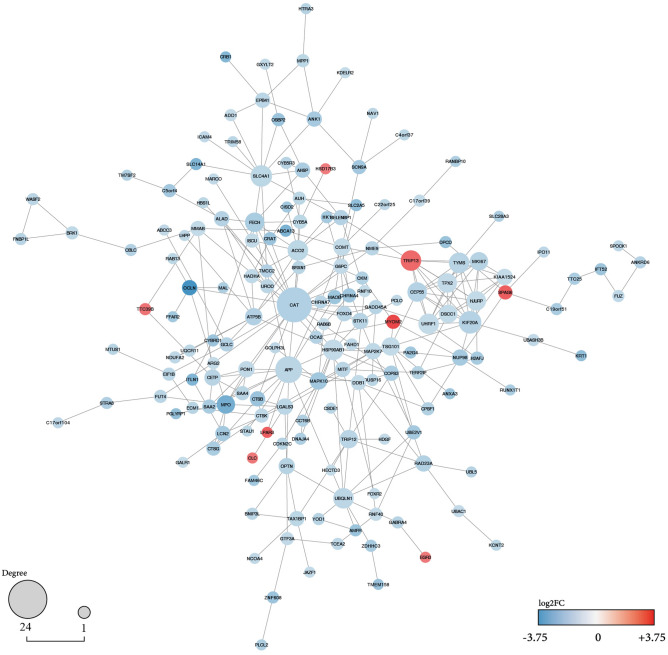
Figure 4.
Protein–protein interactions network with DEGs for brain metastasis in SCLC. Up and down-regulated candidate genes are coloured on the scale of logFC. Log2FC is an indicator of the expression level of these genes since logFC = 3.75 for the most up-regulated gene in BM SCLC patients and logFC = − 3.75 for the most down-regulated gene. The nodes' size characterises the connectivity degree for identifying the critical hub genes (CAT and APP). Unconnected nodes are trimmed from the figure.

