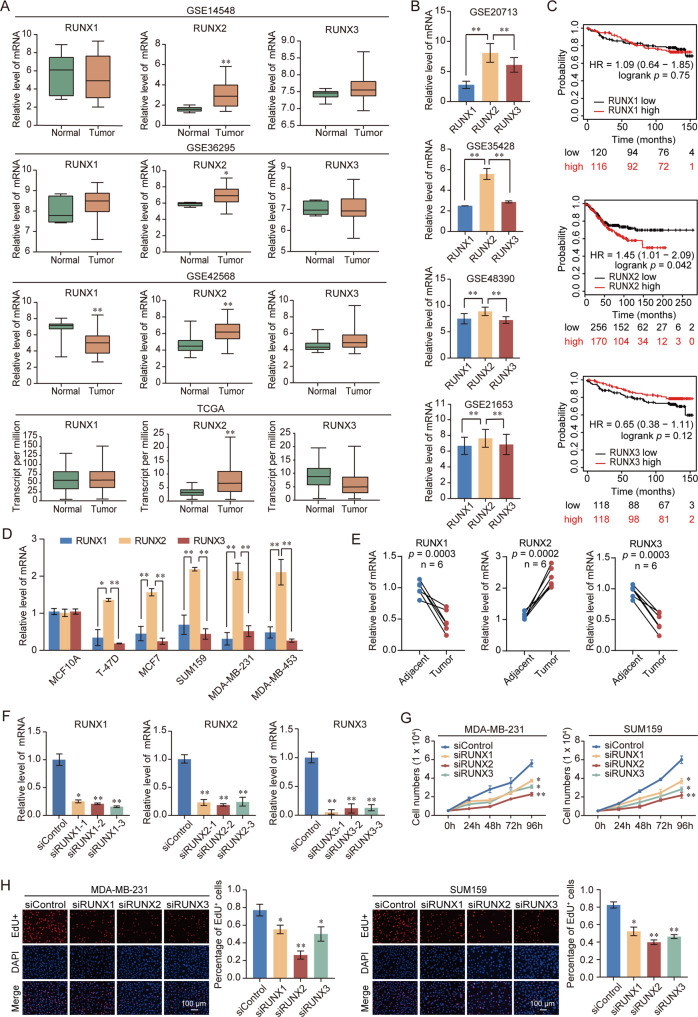
Fig. 1. Upregulation of RUNX2 is correlated with breast cancer progression.
A Analysis of RUNX family expression in normal and breast cancer by using GEO and TCGA database. B Analysis of RUNX family expression in breast cancer by using GEO database. C Kaplan–Meier survival analysis of the relationship between survival time and expression of RUNX family using an online tool (http://kmplot.com/analysis/). D Expression of RUNX family in normal and breast cancer cell lines. E Expression of RUNX family in breast cancer and adjacent tissues (n = 6). Results were presented as mean ± SEM. F Knockdown efficiencies of RUNX1, RUNX2, and RUNX3 were verified by RT-qPCR. G Growth curve assays were performed in MDA-MB-231 and SUM159 cells transfected with siRNA against RUNX1, RUNX2, and RUNX3. H EdU assays were performed in RUNX family-deficient MDA-MB-231 and SUM159 cells and corresponding statistical analysis. Representative images in each group were shown. Results were presented as mean ± SD. Two-tailed unpaired t test, *p < 0.05, **p < 0.01.

