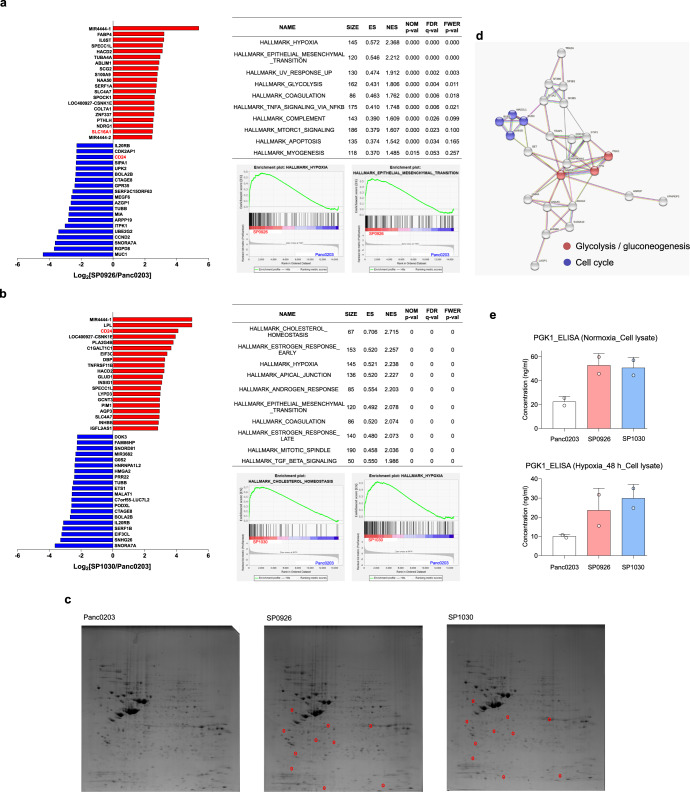
Fig. 3. Multi-omic analyses showing metabolic reprogramming in pancreatic derivative cancer cells derived via direct cell-to-cell transfer.
a Transcriptomic comparison between SP0926 and Panc0203 cells. Left panel shows genes of SP0926 cells differentially expressed compared to parent Panc0203 cells, sorted via RNA sequencing. The top 20 up-regulated (red) and down-regulated (blue) genes are depicted according to fold change. Right upper panel shows the list of the top 10 enriched gene sets in SP0926 cells compared to Panc0203 cells, determined via gene set enrichment analysis (GSEA) using hallmark gene sets (http://www.gsea-msigdb.org/gsea/msigdb/index.jsp). The table shows the number of genes in the gene sets (SIZE), enrichment score (ES), normalized enrichment score (NES), nominal P-value (NOM P-value), false discovery rate (FDR Q-value), and family-wise error rates (FWER Q-value). Right lower panel represents GSEA score curve for ‘HYPOXIA’ and ‘EPITHELIAL_MESENCHYMAL_TRANSITION’ gene sets. b Transcriptomic comparison between SP1030 cells and Panc0203 cells. Left panel shows genes of SP1030 cells differentially expressed compared to parent Panc0203 cells, determined via RNA sequencing. The top 20 up-regulated (red) and down-regulated (blue) genes are depicted according to fold change. Right upper panel shows the list of the top 10 enriched gene sets in SP1030 cells compared to Panc0203 cells determined via gene set enrichment analysis (GSEA) using hallmark gene sets. The table shows the number of genes in gene sets (SIZE), enrichment score (ES), normalized enrichment score (NES), nominal P-value (NOM P-value), false discovery rate (FDR Q-value), and family-wise error rates (FWER Q-value). Right lower panel represents GSEA score curve for ‘CHOLESTEROL_HOMEOSTASIS’ and ‘HYPOXIA’ gene sets. c Ten protein spots similarly upregulated (fold change ≥2; red circles) in both SP0926 and SP1030 cells compared to Panc0203 cells were analyzed using μLC-MS/MS. Among the 10 pairs of spots, two pairs have no significant hits to report. Sixteen proteins were identified in the remaining eight pairs of spots in which ~40% of the pairs were identified as containing multiple proteins. d STRING network analysis of interactions among 16 genes that were up-regulated in both SP0926 and SP1030 cells compared to Panc0203 cells. The analysis was performed by the option of ‘minimum required interaction score: median confidence (0.400)’ and ‘maximum number of interactors to show: no more than 10 interactions (1st shell)’. Functional enrichment analysis was performed for gene sets from the KEGG pathway, and red and blue dots indicate genes belonging to the KEGG pathway enriched in derivative cells. e PGK1 was detected by ELISA using lysates from normoxic (upper panel) and hypoxic (48 h; lower panel) Panc0203, SP0926, and SP1030 cells. Data are presented as the mean values ±SD.

