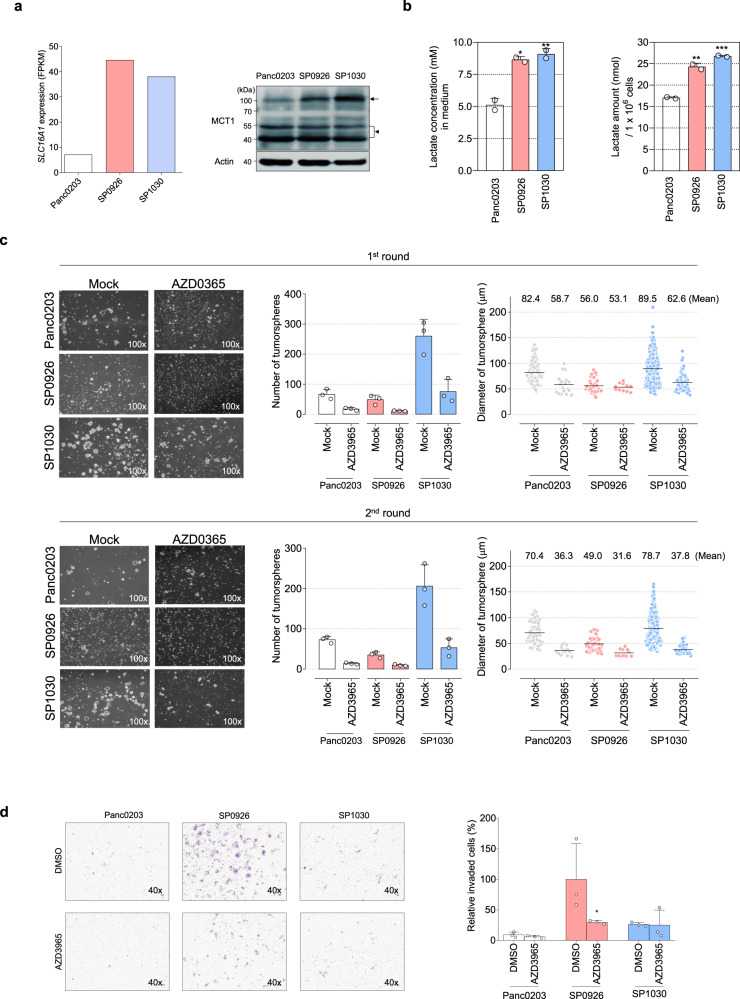
Fig. 5. Roles of MCT1 in anchorage-independent growth and invasive activities of pancreatic derivative cells generated via direct cell-to-cell transfer.
a Comparison of SLC16A1 transcript (Fragments Per Kilobase of transcript per Million; FPKM, left) and MCT1 protein (right) expression levels among Panc0203, SP0926, and SP1030 cells. SLC16A1 transcript levels were estimated by RNA sequencing and MCT1 protein levels were evaluated by western blotting. Arrow and arrow head indicate a dimer form (95–100 kDa) and monomer forms (43–48 kDa), respectively (right, upper). Uncut and unprocessed scans for MCT1 and beta-actin are shown in Supplementary Fig. 5i. b L-lactate concentration in the collected media (left) and l-lactate amount in the 1 × 10⁶ collected cells (right) at 72 h following 3.5 × 10⁵ cells seeding per six-well plates. *P ≤ 0.05; **P ≤ 0.005. One-way ANOVA followed by Tukey’s multiple comparison test. c Inhibition of tumorsphere formation activity by the MCT1 inhibitor AZD3965 (20 μM) compared with DMSO group (Mock). The first-round tumorspheres were observed on day 10 after seeding, and the second-round tumorsphere assay was conducted for 11 days followed by dissociation of the whole spheroids from the first round. d MCT1-dependent invasive activity. Cells were cultured for 24 h in the presence of DMSO or 20 μM AZD3965 in both the upper and bottom chambers. *P ≤ 0.05 as compared to DMSO control (unpaired t test). Data are presented as the mean values ±SD.

