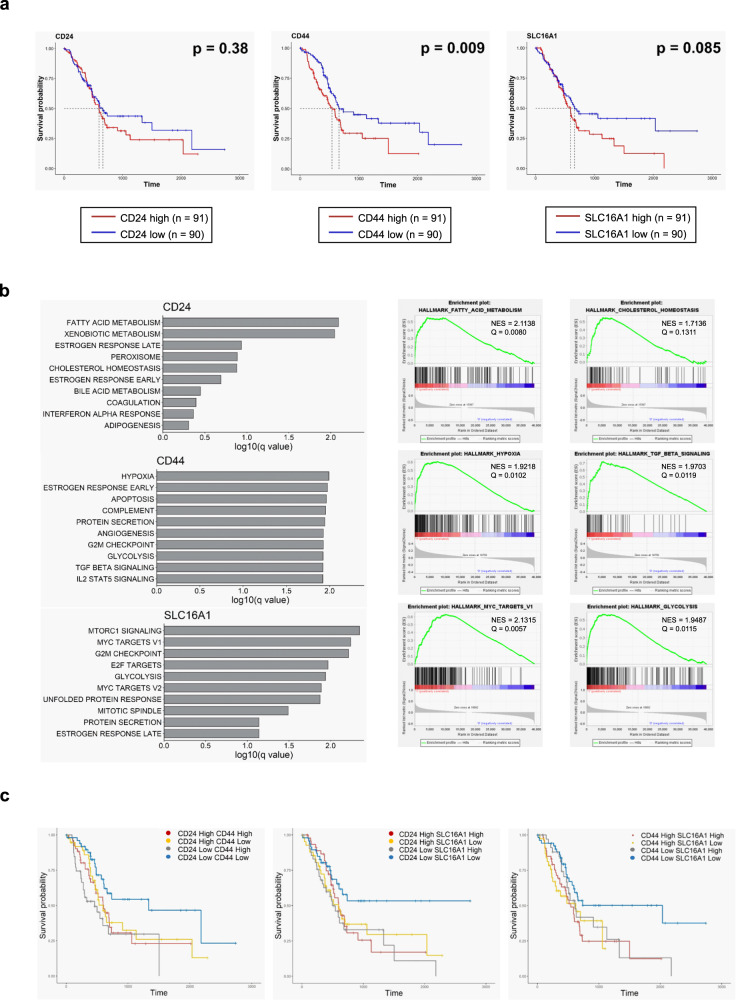
Fig. 6. Clinical significance of CD24, CD44, and SLC16A1 expression in pancreatic cancer-patient tissue samples.
a Kaplan–Meier plot for overall survival of pancreatic cancer patients with high or low expression of CD24, CD44, or SLC16A1. Patients in the TCGA Pancreatic Cancer (PAAD) database (n = 182) were divided into two groups (median cutoff) with either high or low expression of CD24 (left), CD44 (middle), or MCT1 (right). Red and blue lines indicate samples with high or low expression, respectively, of each gene. Each median survival and P-value, determined by a log rank test, is indicated. b Gene set enrichment analysis (GSEA) using hallmark gene sets (http://www.gsea-msigdb.org/gsea/msigdb/index.jsp) between pancreatic cancer patients with high or low expression of CD24, CD44, or SLC16A1. Left panel shows the top 10 enriched gene sets in patients with high expression of genes [upper: CD24, middle: CD44, bottom: SLC16A1]. Right panel shows representative GSEA score curves enriched in patients with high expression of these genes (upper: CD24, middle: CD44, bottom: SLC16A1). c Effect of combined (in pairs) gene expression of CD24, CD44, and SLC16A1 on overall survival of pancreatic cancer patients. Kaplan-Meier plots for overall survival according to patient groups based on the combined gene expression (median cutoff) effects are indicated (left: CD24 and CD44, middle: CD24 and SLC16A1, right: CD44 and SLC16A1).

