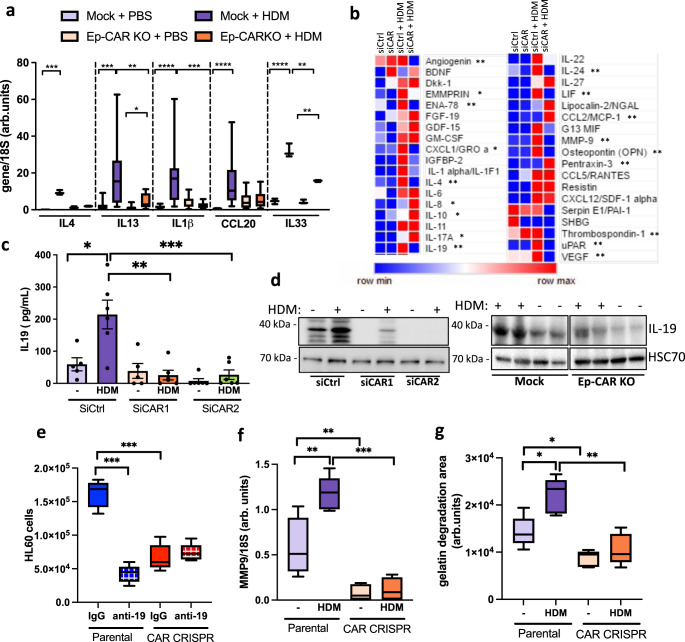
Fig. 2. Lung epithelial CAR contributes to cytokine secretion profiles.
a Levels of IL4, IL13, IL1b, CCL20 and IL33 transcripts from lung extracts specified animal groups measured by qPCR. Data is pooled from 3 independent in vivo experiments with 5 mice per group per experiment. b Summary of results from cytokine array from 16HBE siControl or siCAR cells ± HDM for 24 h. Asterisks indicate significant changes in CAR depleted cells +HDM compared to control cells + HDM c IL-19 levels in supernatants of 16HBE cells ± HDM for 24 h as measured by ELISA. Graph shows pooled date from 6 replicates, representative of 3 independent experiments. d Western blots of lysates from 16HBE as in c or homogenates from total lungs from Mock or Ep-CAR KO mice probed for levels of IL-19 and GADPH. Representative of 4 experiments for each. e Transmigration of HL60 cells in response to supernatants from specified cell lines in presence of control IgG or IL-19 function blocking antibody (anti-19). Data shown from 3 samples per condition; representative of 3 independent experiments. f Levels of MMP9 transcripts from specified cells ± HDM for 24 h measured by qPCR. Data shown from 4 samples per condition; representative of 3 independent experiments. g Degradation of fluorescently labelled gelatin by specified cells ± HDM. Data is from 15 samples per condition; representative of 3 experiments. All graphs show median (line) with 25/75 percentiles (box) and min/max values. One-way ANOVA analysis with Dunnett’s post hoc test was performed to test statistical significance in a, b; two-way ANOVA with Tukey’s post hoc test was used for c, e, f, g. P values *p < 0.05; **p < 0.01; ***p < 0.0005; ****p < 0.0001. Source data are provided as a Source Data file.

