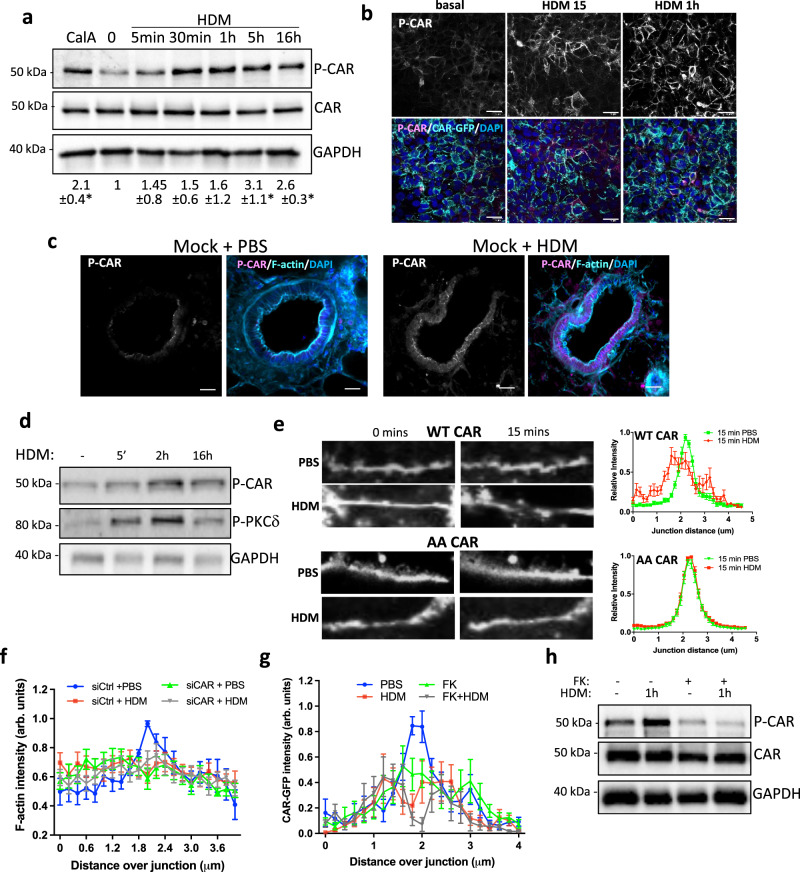
Fig. 4. HDM treatment leads to phosphorylation and increased mobility of CAR at junctions.
a 16HBE CAR-GFP cells treated with Calyculin A (CalA) for 5 min or with HDM for the indicated times. Representative western blots probed for CAR, T290/S293 phospho CAR (P-CAR) and GAPDH. Quantification pf pCAR from three independent experiments is shown below. b Confocal images of CAR-GFP (green) 16HBE cells treated with HDM as indicated. Cells were stained for P-CAR (magenta) and DAPI (blue). Representative of 3 independent experiments. Scale bars; 50 mm. c Confocal images of PLCS from Mock mice ± HDM treatment over 5 weeks, fixed and stained for P-CAR (magenta), F-actin (cyan) and DAPI (blue). Scale bars; 50 mm. d 16HBE cells treated with HDM for indicated times, lysed and subjected to western blotting probing for P-CAR and P-PKCδ. Representative of 3 independent experiments. e Confocal images of live 16HBE CAR-GFP or AACAR-GFP cells treated with PBS or HDM imaged over 60 min. Images at 0 and 15 min are shown. Line graphs of CAR-GFP and AACAR-GFP at cell–cell junctions for 20 different junctions in each condition, representative of 3 independent experiments. f 16HBE cells expressing lifeact-GFP transfected with siControl or siCAR, treated with PBS or HDM and imaged live for 1 h. Graphs show F-actin intensity across junctions for 20 different junctions in each condition, representative of 3 independent experiments. g 16HBE CAR-GFP cells treated with Ad5Fiberknob (FK) for 2.5 h followed by PBS or HDM for 1 h. Graphs show CAR-GFP intensity across junctions for 20 different junctions in each condition, representative of 3 independent experiments. h Cells as in G lysed and probed for P-CAR and total CAR. All values are mean ± SEM. One-way ANOVA analysis with Dunnett’s post hoc test was performed to test statistical significance in a. P values *p < 0.05. Source data are provided as a Source Data file.

