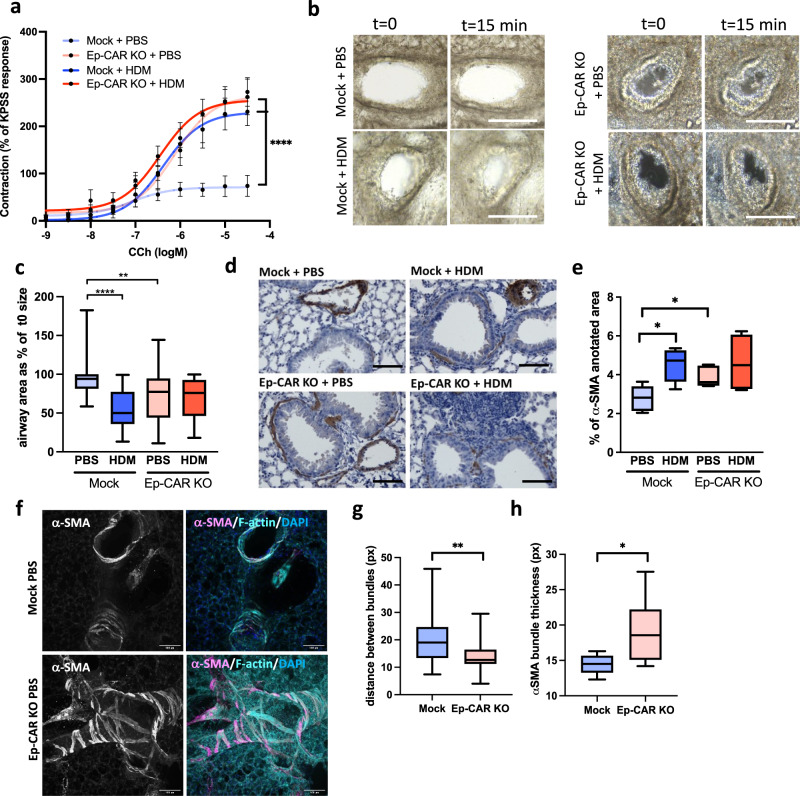
Fig. 6. Depletion of epithelial CAR induces airway hypercontractility.
a Airways dissected from Mock and Ep-CAR KO mice treated with PBS or HDM over 5 weeks, mounted on a myograph and treated with carbachol (CCh). Graph shows mean increase in contraction (mN) dose response curves to CCh (1 nM to 30 µM) expressed as a mean % of the high K+ positive control (KPSS). Data shown for 5 airways from 5 mice per group, representative of 2 experiments. b Images from PCLS before and after being subjected to 0.5 g/ml of Metacholine for 15 min. Scale bars: 100 mm. c Graph showing airway area as % of starting size after 15 min treatment with Metacholine from 25 airways from each experimental group; from 5 mice per condition; representative of 3 independent experiments. d Representative images of bronchi from indicated mice stained for α-smooth muscle actin (SMA; brown) and Haematoxylin (nuclei; blue). Scale bars: 50 μm. e Quantification of α-SMA intensity around airways from 25 different airways and 5 mice per condition; representative of 3 independent experiments. f Representative confocal Z-projection of PCLS from Mock vs. Ep-CAR KO treated with PBS fixed and stained for a-SMA (magenta), Phalloidin (cyan) and DAPI (blue). Scale bars: 100 mm. g, h Quantification of distance between F-actin bundles (G) and thickness of α-SMA bundles from images of 30 different airways pooled from 5 mice per condition (1 PCLS/mouse) and representative of 3 independent experiments. All graphs show median (line) with 25/75 percentiles (box) and min/max values except for a where mean ± SEM are shown. One-way ANOVA analysis with Dunnett’s post hoc test was performed to test statistical significance in a, c, e; unpaired 2-tail student’s T-tests were performed on data in g, h;. P values **p < 0.01; ****p < 0.0001. Source data are provided as a Source Data file.

