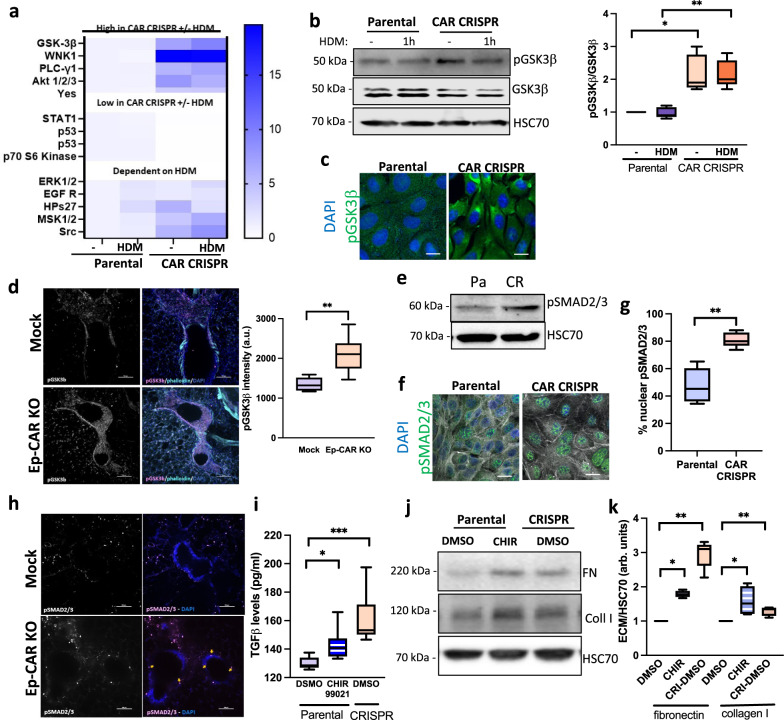
Fig. 8. CAR controls a GSK3β-TGF-β signalling axis in lung epithelium.
a Lysates from parental and CAR CRISPR 16HBE cells ± HDM subjected to analysis using the Human Phospho-Kinase Array. Phosphorylation fold changes of target proteins are indicated according to scale bar. b Representative western blot of lysates from cells as in a probed for pGSK3β, GSK3β and HSC70. Quantification from three independent experiments is shown. c Confocal images of parental and CAR CRISPR 16HBE cells stained for pGSK3β (green) and DAPI (blue). Scale bars: 10 mm. d Representative confocal Z-projection of PCLS from Mock or Ep-CAR KO mice, fixed and stained for pGSK3b (magenta), F-actin (cyan) and DAPI (blue). Scale bar: 100 mm. Graph to right shows quantification of pGSK3b from 30 different airways pooled from 5 mice per condition (1 PCLS/mouse) and representative of 3 independent experiments. e Lysates from parental and CAR CRISPR 16HBE cells probed for pSMAD2/3 and HSC70. f Confocal images of parental and CAR CRISPR 16HBE cells stained for pSMAD2/3 (green) and DAPI (blue); F-actin is shown in white. g Quantification of nuclear pSMAD2/3 from images as in f. 10 fields of view per condition per experiment quantified, representative of 3 independent experiments. h Representative confocal Z-projections of PLCS from Mock and Ep-CAR KO mice stained for pSMAD2/3 (magenta) and DAPI (blue). Scale bar: 100 mm. i Lysates from parental and CAR CRISPR 16HBE cells treated with the GSK3β inhibitor CHIR99021 assays for TGF-β levels using ELISA. 3 replicates per condition, pooled from 3 independent experiments. j Lysates from cells treated as in i probed for fibronectin, collagen I and HSC70. k Quantification of western blots as in j. Data pooled from three independent experiments is shown in the right. All graphs show median (line) with 25/75 percentiles (box) and min/max values. Unpaired 2-tail student’s T-tests were performed on data in d, g; One-way ANOVA analysis with Dunnett’s post hoc test was performed to test statistical significance in i; two-way ANOVA analysis with Tukey’s post hoc test was used for b, k. Significance values are *p < 0.05; **p < 0.01; ***p < 0.001. Source data are provided as a Source Data file.

