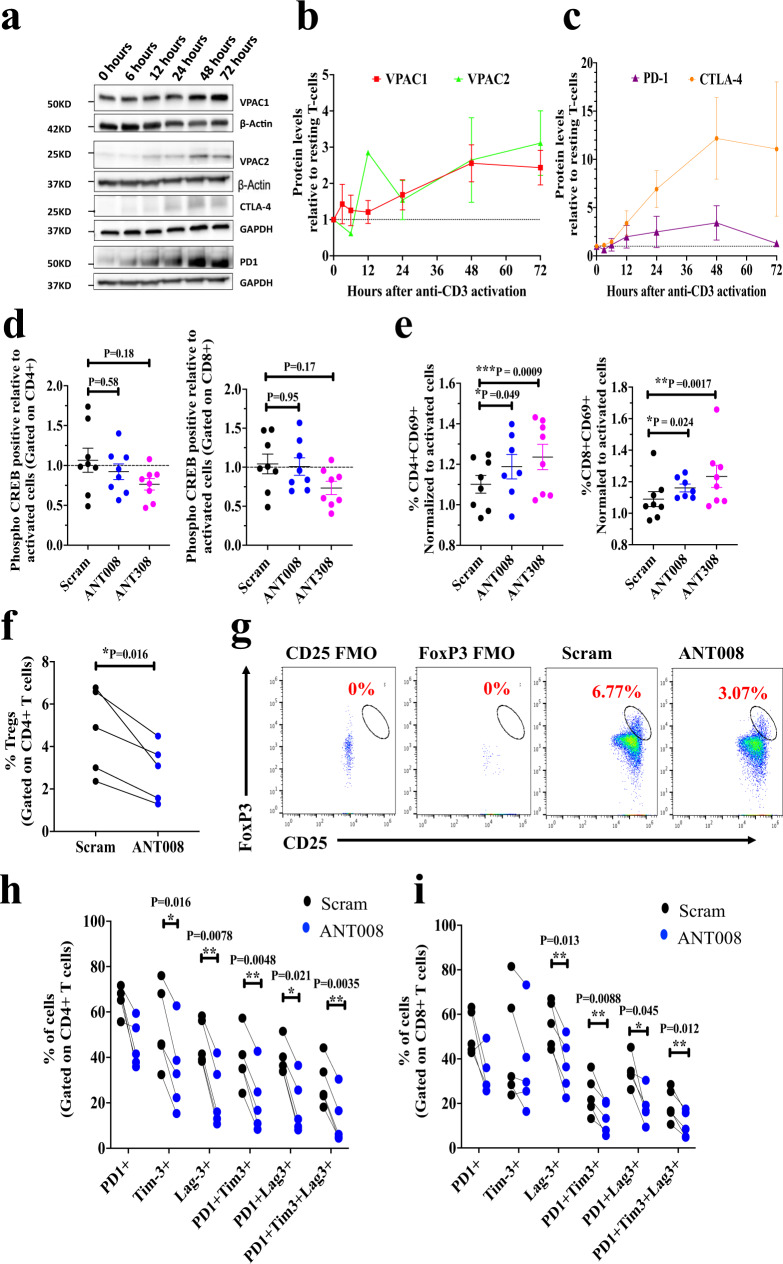
Fig. 2. Inhibition of VIP-R signaling decreases T cell exhaustion in ex vivo human T cell cultures.
a Representative western blot. The experiment was repeated two times with similar results. b quantified expression levels of VPAC1 (n = 5) and VPAC2 (n = 4 biologically independent samples); and (c) PD-1 (n = 2 biologically independent samples) and CTLA-4 (n = 5 biologically independent samples) in lysates of healthy human T cells expanded with plate-bound human anti-CD3 antibodies for 0, 3, 6, 12, 24, 48 and 72 h. Percentage of (d) phosphorylation of CREB (phospho-CREB) downstream of VPAC1/2 receptor at 6 h (n = 8 biologically independent samples) and (e) CD69 expression at 24 h post activation in CD4+ and CD8+ T cells normalized to levels in control with no peptide (n = 8 biologically independent samples). PDAC patient peripheral blood T cells (n = 5 biologically independent samples) were expanded for 9 days with plate-bound human anti-CD3 antibodies ± ANT008 and the (f) percentage of Tregs was quantified using the (g) gating strategy shown. Percentage of PD1+, Tim-3+, Lag3+ PD1+, Tim-3+, PD1+ Lag3+ and PD1+ Tim-3+Lag-3+(triple positive) in (h) CD4+ and (i) CD8+ subsets is shown. Statistical differences shown in panels (d, e) were calculated via mixed effects ANOVA followed by Dunnett’s post-test where each sample in the treatment group was compared to the matched sample in the control group (scrambled peptide treated). Statistical differences in panels (f), (h), (i) were calculated via two-tailed paired student T-test. Error bars show mean ± SEM. *p < 0.05, **p < 0.01 and ***p < 0.001.

