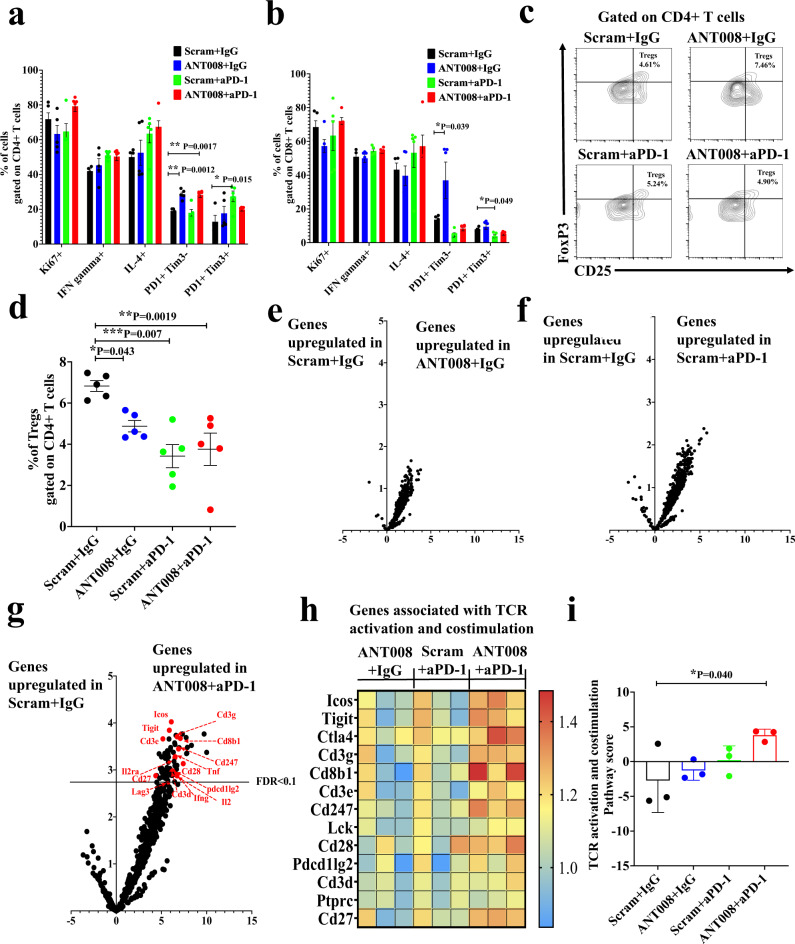
Fig. 4. Increased T cell activation and reduced frequency of Tregs in KPC.Luc tumors treated with a combination of VIP-R antagonist and anti-PD-1.
Subcutaneous KPC.Luc tumors in female C57BL/6 mice treated with ANT008 and/or anti-PD-1 (n = 5 per treatment group), were analyzed via flow cytometry 10 days after treatment for proportion of (a) CD4+ and (b) CD8+ T cells expressing Ki67, IFN gamma, IL-4, PD-1 and Tim-3. c Representative flow plots showing the gating strategy used to quantify CD25+ FoxP3+ Tregs. d Percentage of Tregs in tumors of the different treatment groups (n = 5 per treatment group). Volcano plot showing differential expression of genes in T cells from (e) ANT008 + isotype IgG (IgG) vs scrambled peptide (Scram) + isotype IgG, (f) scrambled peptide + anti-PD-1 vs scrambled peptide + isotype IgG and (g) ANT008 + anti-PD-1 vs scrambled peptide + isotype IgG (n = 3 mice per treatment group). Horizontal black line represents false discovery rate (FDR) < 0.1. Genes that are associated with TCR activation and co-stimulation and are at levels significantly higher when compared to Scram+ isotype IgG (FDR < 0.1) are labeled in red. h Heat map showing gene expression changes in genes associated with TCR activation and co-stimulation. i TCR activation and co-stimulation pathway score between the T cells in tumors of mice from the different treatment groups. Statistical differences shown in panels (a, b, d, i) were calculated via ANOVA followed by Dunnett’s post-test. Error bars show mean ± SEM *p < 0.05, **p < 0.001, ***p < 0.0001.

