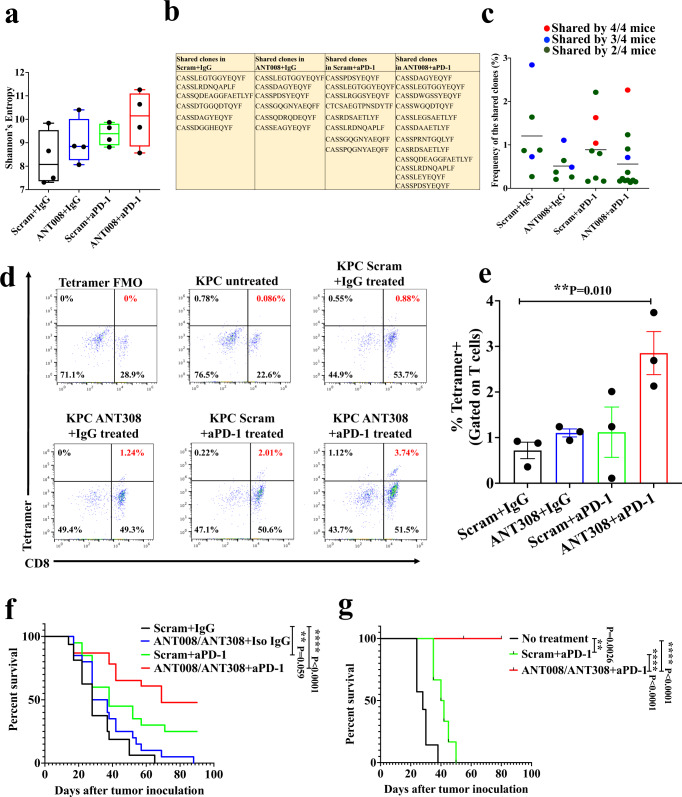
Fig. 5. Combination therapy with VIP-R antagonist and anti-PD-1 increased frequency of tetramer+, and CD8+ T cells within the tumor and provide protective immunity to tumor re-challenge.
a Box and whiskers plot showing minimum to maximum Shannon’s Entropy in T cells of KPC.Luc tumors in each treatment group. The mid-line represents the median value for each group. b List showing TCR-ß amino acid sequences shared between samples of each treatment group and (c) the frequencies of the shared clones in each treatment group. Sequences are color-coded to represent number of mice per group (n = 4) that share the specific TCR-ß clone. CD8+ in subcutaneous KPC.Luc tumors were stained with MuLV p15E-H2Kb tetramer after 10 days of treatment with ANT308 and/or anti-PD-1 (n = 3 per treatment group) using the (d) gating strategy and (e) quantified. f Kaplan–Meier survival curves of subcutaneous KPC.Luc bearing mice treated with ANT008/ANT308 and/or anti-PD-1 from day 3-12 after tumor implantation (n = 16 per scrambled peptide + isotype IgG, n = 20 in ANT008/ANT308 + isotype IgG and in scrambled peptide + anti-PD-1 treatment groups; n = 23 in ANT008/ANT308 + anti-PD-1 treatment group). g Kaplan–Meier survival curves of tumor-free mice from panel f that were re-challenged with KPC.Luc tumors on the opposite flank (n = 6 in scrambled peptide + anti-PD-1 treatment group; n = 8 in ANT008/ANT308 + anti-PD-1 treatment group). Immunologically-naïve C57BL/6 mice (with no prior tumor exposure or treatment) were inoculated with tumor cells at the same time of the rechallenge (n = 7). Statistical differences shown in panels (a, e) were calculated via ANOVA followed by Dunnett’s post-test, and in panel f, g were calculated using Log-rank test. Error bars show mean ± SEM *p < 0.05, **p < 0.01, ****p < 0.0001.

