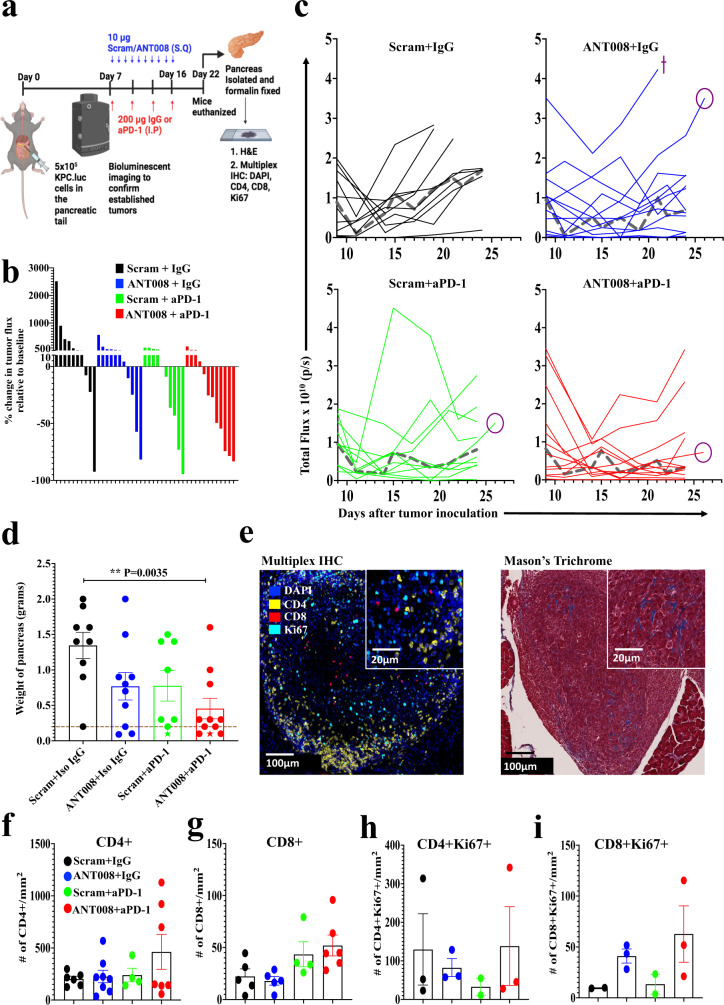
Fig. 6. Synergism between ANT008 and anti-PD-1 increases T cell infiltration and proliferation and decreases tumor burden in orthotopic KPC.Luc murine PDAC.
KPC.Luc cells were orthotopically implanted in the tail of the pancreas of C57BL/6 female mice and treated with ANT008 and/or anti-PD-1 with n = 9, 10, 8 and 11 in scrambled+IgG, ANT008 + IgG, scrambled+anti-PD-1 and ANT008 + anti-PD-1, respectively. a Schematic showing orthotopic implantation of KPC.Luc cells and treatment strategy with ANT008 and/or anti-PD-1 was created using BioRender. b Waterfall plot showing % change in tumor flux on day 22 relative to day 7 prior to start of treatment. c Total flux as measured by IVIS bioluminescent imaging in the different treatment groups. Isoflurane was used for anesthesia for bioluminescent imaging. Median flux represented as a dashed gray line (┉). Cross symbol (+) represents mice that were euthanized before day 25 due to ulceration of the tumor and circle symbol (○) represents the mice (one from each group) that were imaged on day 26 via MRI imaging shown in supplementary figure S5. d Bar graph showing the weight of pancreas on day 25 when the mice were euthanized. ‘Star’ shaped (★) data points indicate tumor-free mice, and the dotted horizontal line represents the average weight of healthy pancreas from naïve mice. e Representative multiplex IHC images (right) showing pancreatic tumors stained for DAPI (blue), CD4 (yellow), CD8 (red), and Ki67 (cyan) and trichrome staining (left) with black arrows showing blue collagen stain in the tissue. The experiment was performed once with multiple groups stained at the same time. Bar plot showing number of (f) CD4+ or (g) CD8 + T cells/mm2; and (h) Ki67 + CD4 + or (i) Ki67 + CD8 + T cells/mm2. P values shown in panel (d) were calculated using student ANOVA followed by Dunnett’s post hoc test (comparing each treatment group with Scram + IgG). Error bars show mean ± SEM. **p < 0.01.

