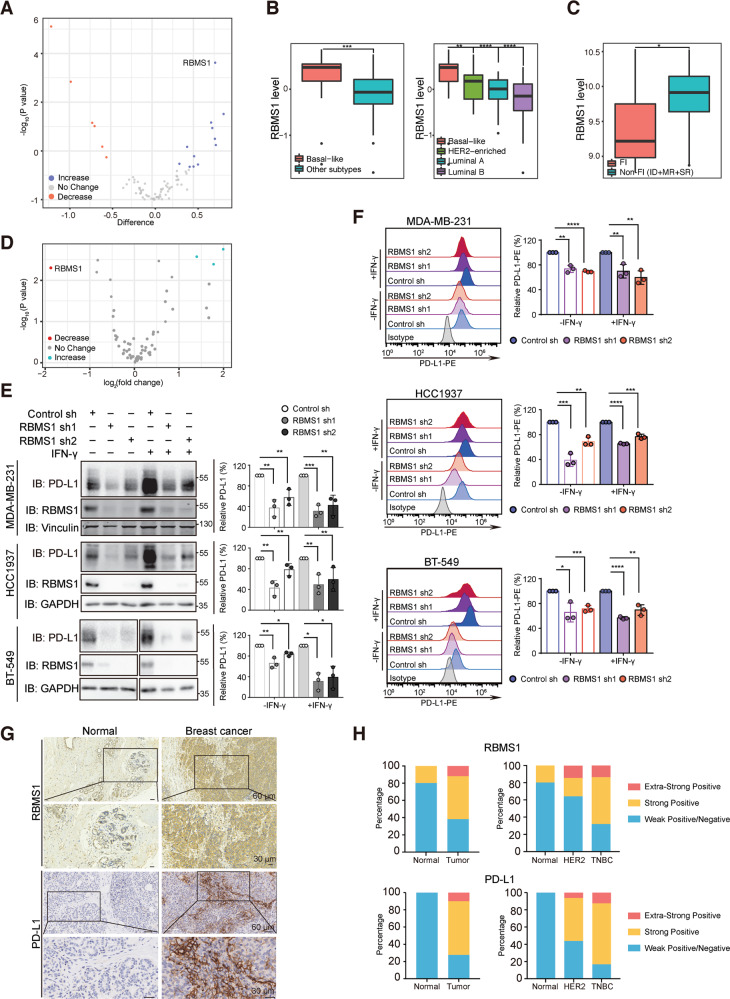
Fig. 1. Systematic identification of RBMS1 as a key regulator of PD-L1 in cold TNBC.
A Volcano plot illustrating the protein levels of 82 RNA binding proteins in basal-like subtype vs luminal A, luminal B, and HER2 subtypes of breast cancer. RBPs levels increased (blue) or decreased (red) are highlighted. B The protein level of RBMS1 in basal-like subtype and other subtypes of breast cancer was obtained from (A) and plotted (left). The protein level of RBMS1 in basal-like, luminal A, luminal B, or HER2 subtypes of breast cancer was analyzed respectively from (A) and plotted (right). C The mRNA levels of RBMS1 in FI, and non-FI (SR + MR + ID) were obtained from thirty-eight TNBC patient samples from GSE88847. P values were determined using by unpaired t test or one-way ANOVA with Dunnett multiple comparisons in (B) and (C). D Volcano plot illustrating the RNA binding proteins whose depletion can regulate the level of PD-L1. RBPs depletion could reduce (red) or increase (blue) the level of PD-L1 are highlighted. E The levels of PD-L1 and RBMS1 were measured in RBMS1 stably depleted MDA-MB-231, BT-549, and HCC1937 breast cancer cells in the absence or presence of IFN-γ. Data represent mean ± SD, n = 3 independent repeats. P values were determined using by One-way ANOVA with Dunnett multiple comparisons. F MDA-MB-231, HCC1937, and BT-549 cells with stable depletion of RBMS1 were treated with or without IFN-γ. Cell surface analysis of PD-L1 protein using flow cytometry was shown. Data showed relative fold change in the MFI of PD-L1. Error bar represent mean ± SD. P values were determined by One-way ANOVA with Dunnett multiple comparisons. G Representative images from immunohistochemical staining of RBMS1 and PD-L1 in breast cancers (n = 40) and normal breast tissues (n = 10). Scale bars are indicated in the pictures. H The quantification of RBMS1 and PD-L1 protein levels in breast cancer and normal breast tissues. The RBMS1 and PD-L1 level were respectively classified into three grades (weak positive/negative, strong positive, extra-strong positive) by results from immunohistochemical staining and plotted. *P < 0.05, **P < 0.01, ***P < 0.001, ****P < 0.0001 for all panels.

