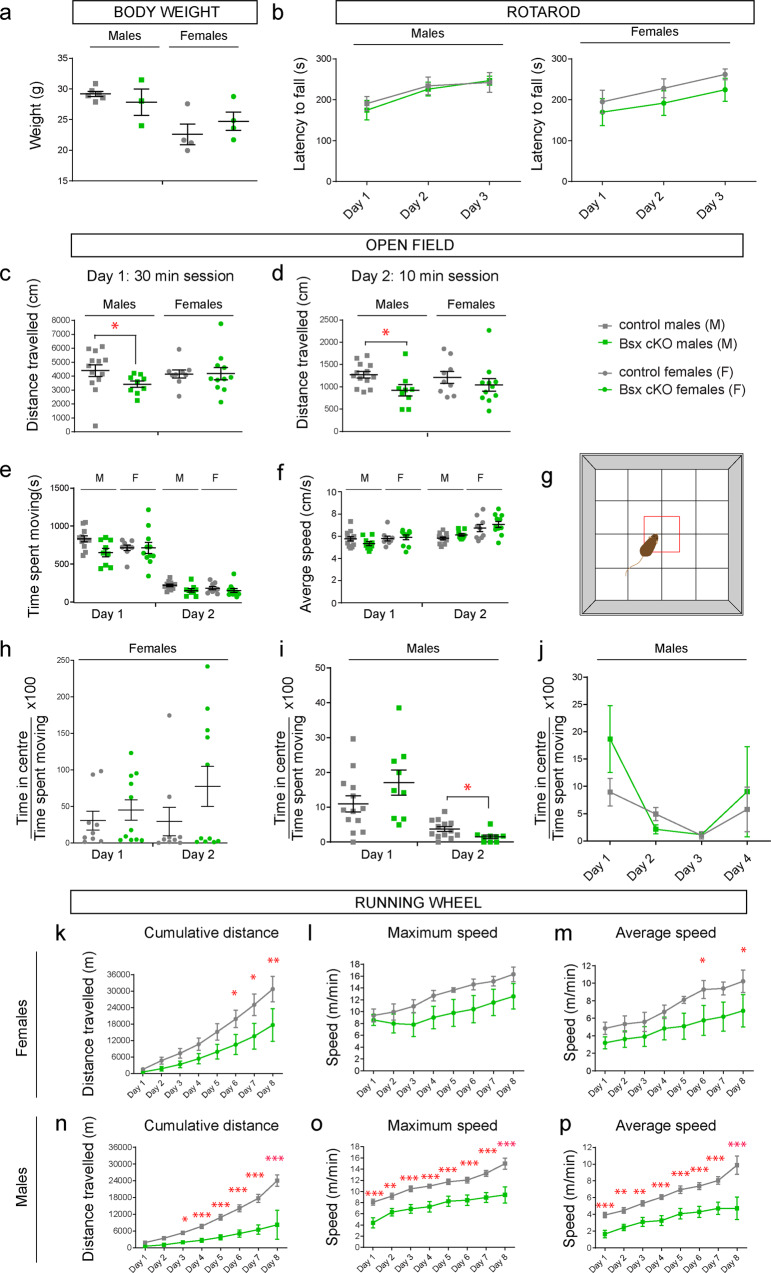
Fig. 7. Behavioural assessment of septal Bsx cKO mice: essential role for Bsx in locomotion.
a Body weight: no differences in body weight values found between control and mutant mice. Males: controls n = 6, Bsx cKO n = 3. Females: controls n = 4, Bsx cKO n = 4. Unpaired t-test with Welch’s correction. P > 0.05. b Rotarod: latency to fall from the Rotarod throughout a 3-day test is shown. Males: controls n = 8, Bsx cKO n = 6. Females: controls n = 7, Bsx cKO n = 6. 2-way RM ANOVA. No significant effect of genotype. Gradual improvement was detected for all mice indicating that motor learning has occurred (Effect of Day, 2-way RM ANOVA, Males, P = 0.0003; Females, P < 0.0001). c–j Open field task. c–d distance travelled over a 2-day test. Only mutant males show reduced distance travelled on both days compared to controls. Mann Whitney U test, Day 1, P = 0.025; Day 2, P = 0.014). e, f similar time spent moving and average speed between control and mutant mice over a 2-day test. g diagram showing the open field arena. The centre of the arena is shown as a red box. h similar time spent in centre between female control and mutant mice. i, male mutants showed reduced time in centre on day 2 (Mann Whitney U test, Day 2, P = 0.0215) but this was not significant over a 4-day test period (j). c–i Males: controls n = 13, Bsx cKO n = 9. Females: controls n = 9, Bsx cKO n = 11. j: controls n = 6, Bsx cKO n = 5. k–p Running wheel task: female and male BSX cKO mice show reduced cumulative distance run on the wheel. Females: n = 4 mice for each genotype. 2-way RM ANOVA, Fisher’s LSD test *P < 0.05, **P < 0.01, ***P < 0.001. Distance: effect of Day P < 0.0001. Max speed: effect of Day P < 0.0001. Average speed: effect of Day P < 0.0001. Males: controls n = 11; Bsx cKO n = 9 except day 8 where n = 3 for both groups. Distance: effect of Genotype P < 0.0001, Day P < 0.0001 and Interaction P < 0.0001. Max speed: effect of Genotype P = 0.0004 and Day P < 0.0001. Average speed: effect of Genotype P = 0.0002 and Day P < 0.0001. All graphs show mean ± SEM. Source data are provided in Supplementary Data 1.

