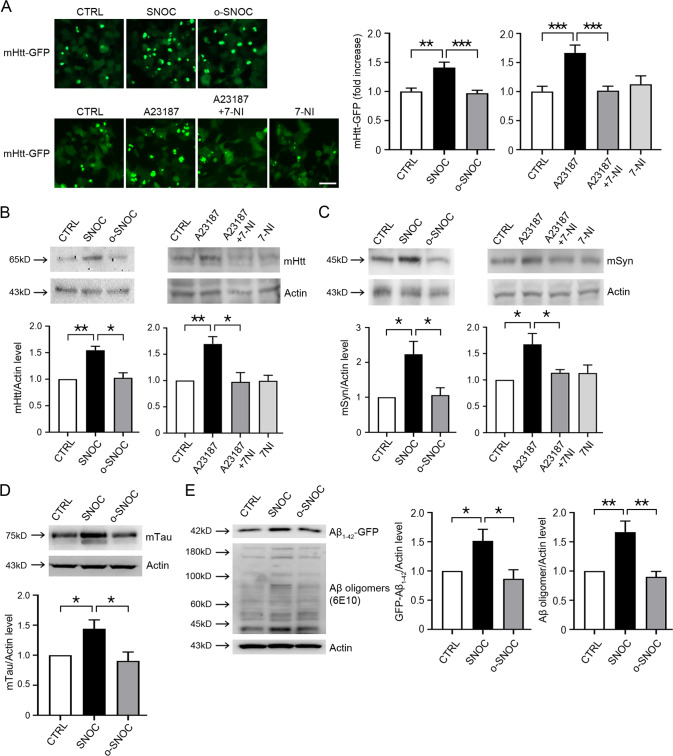
Fig. 2. RNS augment protein aggregates.
A Fluorescence microscope image of GFP-mHtt aggregates in nNOS-HEK cells. GFP-mHtt plasmid was transiently transfected into nNOS-HEK cells two days before drug treatment. Cells were evaluated 2 h after exposure to 200 μM SNOC or o-SNOC, or 7 h after addition of 10 μM A23187 alone or A23187 plus 10 μM 7-Nitroindazole (7-NI). Scale bar, 50 μm. Bar graphs represent quantitative analysis of GFP-mHtt fluorescence intensity. The mean intensity of GFP-mHtt fluorescence was quantified in a given microscopic field using Image J software (mean ± SEM, n = 8 different fields taken from ≥3 independent biological replicate experiments). **p < 0.01 or ***p < 0.001 by ANOVA with Dunnett’s test for post-hoc analysis. B Western blot analysis for accumulation of mHtt. GFP-mHtt plasmid was transiently transfected into nNOS-HEK cells two days before drug treatment. Protein samples were prepared 2 h after sham wash (CTRL) or exposure to SNOC or o-SNOC, or 7 h after exposure to A23187 alone or A23187 plus 7-NI. Quantification of the GFP-mHtt level from ≥3 independent biological replicate experiments. *p < 0.05 or **p < 0.01 by ANOVA with Dunnett’s test for post-hoc analysis. C Western blot analysis for accumulation of mutant α-synuclein (mSyn). A plasmid encoding mt-α-synuclein was transiently transfected into nNOS-HEK cells two days before drug treatment. Protein samples were prepared 2 h after sham wash (CTRL) or exposure to SNOC or o-SNOC, or 7 h after exposure to A23187 alone or A23187 plus 7-NI. Quantification of α-Syn level from ≥3 independent biological replicate experiments. *p < 0.05 by ANOVA with Dunnett’s test for post-hoc analysis. D Western blot analysis of accumulation of mutant tau(P301L). Tau P301L-GFP plasmid was transiently transfected into HEK cells one day prior to exposure to SNOC. Protein samples were prepared 2 h after sham wash (CTRL), or exposure to 200 μM SNOC or o-SNOC. Quantification of tau P301L-GFP from ≥3 biological replicate experiments, *p < 0.05 by ANOVA with Dunnett’s test for post-hoc analysis. E Western blot analysis for an accumulation of Aβ1-42. Aβ1-42-GFP plasmid was transiently transfected into HEK cells two days prior to SNOC exposure. Protein samples were prepared 2 h after sham wash (CTRL), or exposure to SNOC or o-SNOC. Quantification of Aβ1-42-GFP or Aβ1-42 oligomers (6E10) from ≥ 3 biological replicate experiments, *p < 0.05 or **p < 0.01 by ANOVA with Dunnett’s test for post-hoc analysis. Oligomers were quantified by densitometry of multiple bands.

