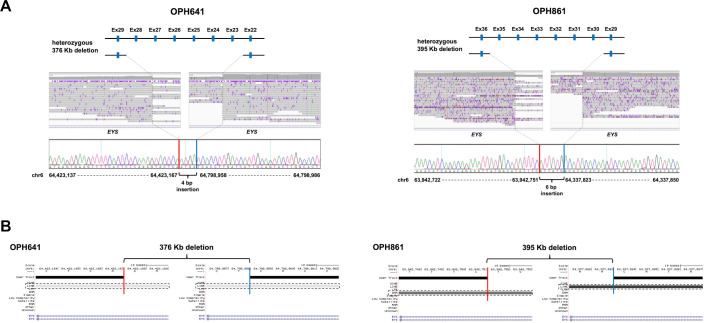
Figure 2.
The causative structural variants (SVs) in EYS. (A) A schematic diagram of heterozygous deletions (top), an integrative genomics viewer (IGV) visualisation of the breakpoints of deletions (middle), and the exact breakpoint sequences confirmed by Sanger sequencing (bottom) in OPH641/OPH861 are shown. In each patient, 4 bp (OPH641)/6 bp (OPH861) insertions were identified within the deletion breakpoints. For example, exon. (B) The genetic elements to which the breakpoints belong to are shown. The downstream breakpoint of the deletion in OPH861 belongs in a repetitive region, and others belong in Long Interspersed Elements (LINE). Red and blue bars display the downstream/upstream breakpoint junctions. The dashed rectangles indicate the genetic elements where the breakpoints are localised.

