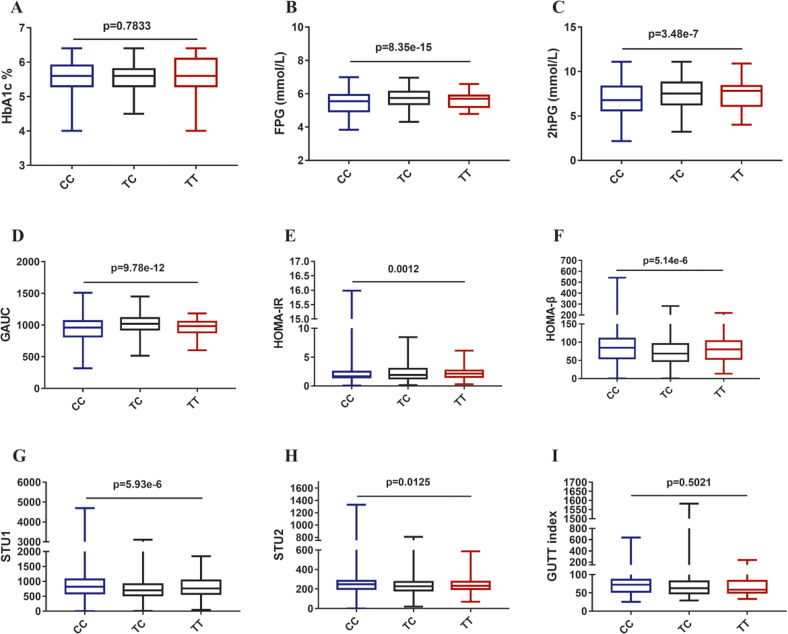
Fig. 1. Associations between rs3819316 C > T mutation and glucose metabolism related indexes.
Associations of rs3819316 C > T mutation with glucose metabolism related indexes were analyzed after adjustment for gender, age and body mass index (BMI). A Analysis of glycated hemoglobin A1c (HbA1c); B Analysis of fasting plasma glucose (FPG); C Analysis of 2 h plasma glucose (2hPG) based on oral glucose tolerance test; D Analysis of the area under the curve of the glucose (GAUC) from 0 to 120 min based on oral glucose tolerance test; E Analysis of homeostasis model assessment of insulin resistance (HOMA-IR); F Analysis of homeostasis model assessment of β cell function (HOMA-β); G Analysis of Stumvoll first-phase insulin secretion (STU1); H Analysis of Stumvoll second-phase insulin secretion (STU2). I Analysis of GUTT index based on oral glucose tolerance test. Data shown as median (interquartile range), N. Kruskal Wallis test for continuous variables and χ2 test for categorical variables were applied to assess the differences among three groups.

