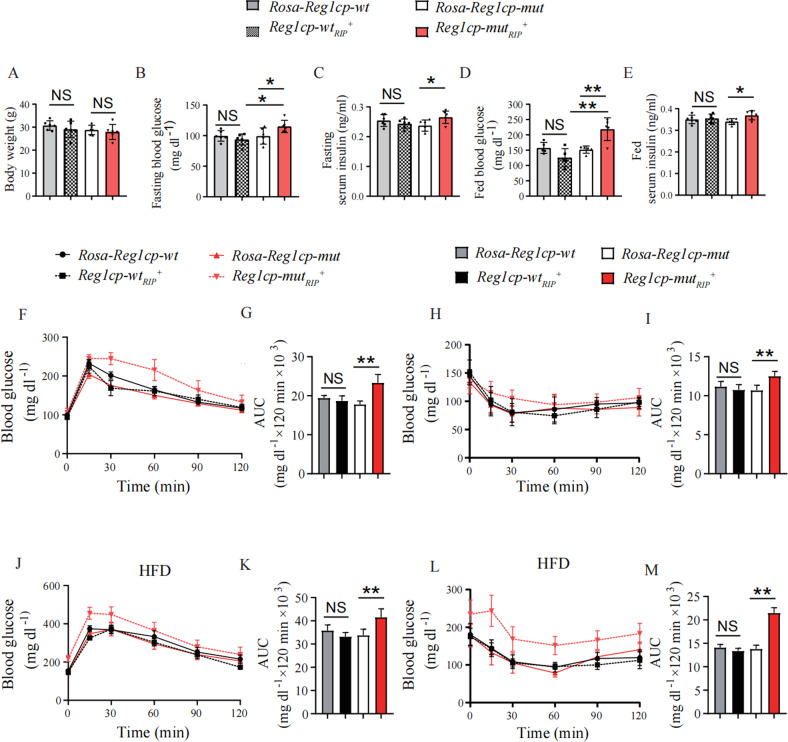
Fig. 2. Mut-Reg1cp impaired the glucose metabolism in mice.
A–E The body weight (A), fasting blood glucose level (B), fasting serum insulin level (C), fed blood glucose level (D) and fed serum insulin level (E) of Rosa-Reg1cp-wt, Rosa-Reg1cp-mut, Reg1cp-wtRIP+ and Reg1cp-mutRIP+ mice under regular diet. F–I The GTTs (F) and ITTs (H) in Reg1cp-wtRIP+, Reg1cp-mutRIP+ mice and related Rosa-Reg1cp-wt and Rosa-Reg1cp-mut controls under regular diet. Bar graphs showing the calculated values for area under curve (AUC) during the 120-min test course of the GTTs (G) and ITTs (I) (mg dl−1 × 120 min × 103). J–M The GTTs (J) and ITTs (L) in Reg1cp-wtRIP+, Reg1cp-mutRIP+ mice and related Rosa-Reg1cp-wt and Rosa-Reg1cp-mut controls under HFD. Bar graphs showing the calculated values for area under curve (AUC) during the 120-min test course of the GTTs (K) and ITTs (M) (mg dl−1 × 120 min × 103). n = 6 in each group from three independent experiments. Data shown as mean ± SD. *P < 0.05; **P < 0.01; NS no significance; One-way ANOVA.

