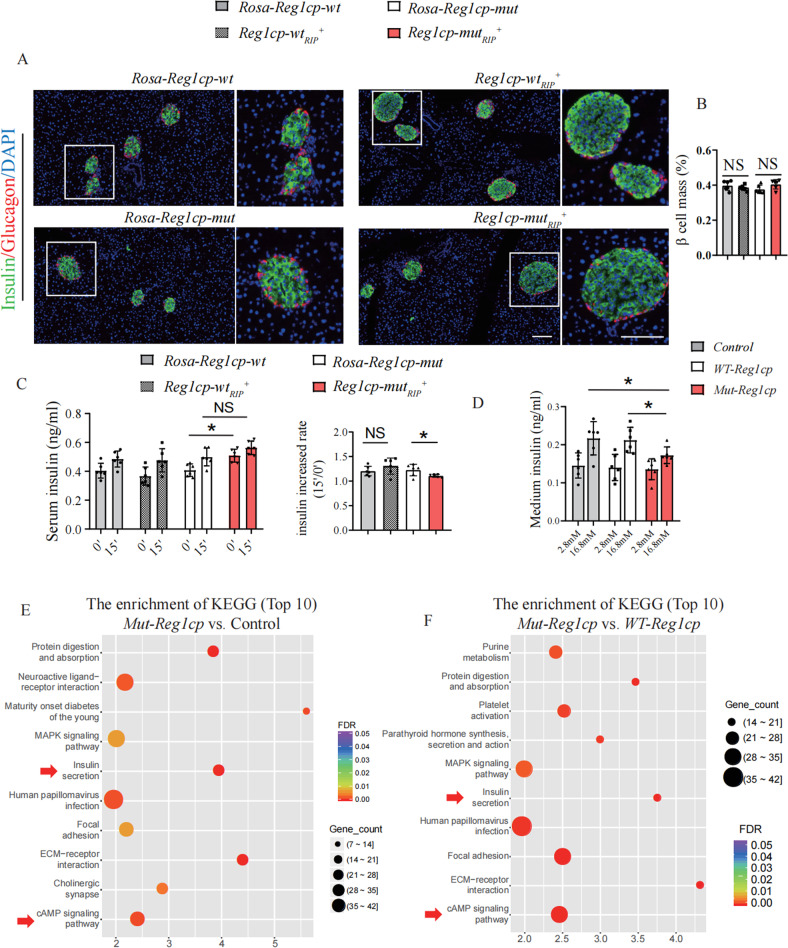
Fig. 3. Mut-Reg1cp aggravated hyperglycemia by impaired β cell function.
A, B Representative immunostaining images of insulin (green), glucagon (red) and DAPI, nucleus (blue) (A) and quantification of β cell mass (B) in Reg1cp-wtRIP+, Reg1cp-mutRIP+ mice and related Rosa-Reg1cp-wt and Rosa-Reg1cp-mut controls under regular diet. Scale bar: 100 μm. C In vivo GSIS test analysis of glucose stimulated insulin level (left panel) and the increased rate of insulin after glucose stimulation (right panel) of Rosa-Reg1cp-wt, Rosa-Reg1cp-mut, Reg1cp-wtRIP+ and Reg1cp-mutRIP+ mice (0’ and 15’ means 0 and 15 min after an intraperitoneal injection of glucose). D In vitro GSIS test analysis of glucose stimulated insulin level in MIN6 cells transfected with Control, Mut-Reg1cp or WT-Reg1cp plasmids. E Top 10 changed cellular functions which differentially expressed genes enriched in indicated by KEGG-enrichment analysis of MIN6 cells transfected with Mut-Reg1cp or Control plasmids. F Top 10 changed cellular functions which differentially expressed genes enriched in indicated by KEGG-enrichment analysis of MIN6 cells transfected with Mut-Reg1cp or WT-Reg1cp plasmids. In A–D, n = 6 in each group from three independent experiments. In E, F, n = 3. Data shown as mean ± SD. *P < 0.05; NS no significance; One-way ANOVA.

