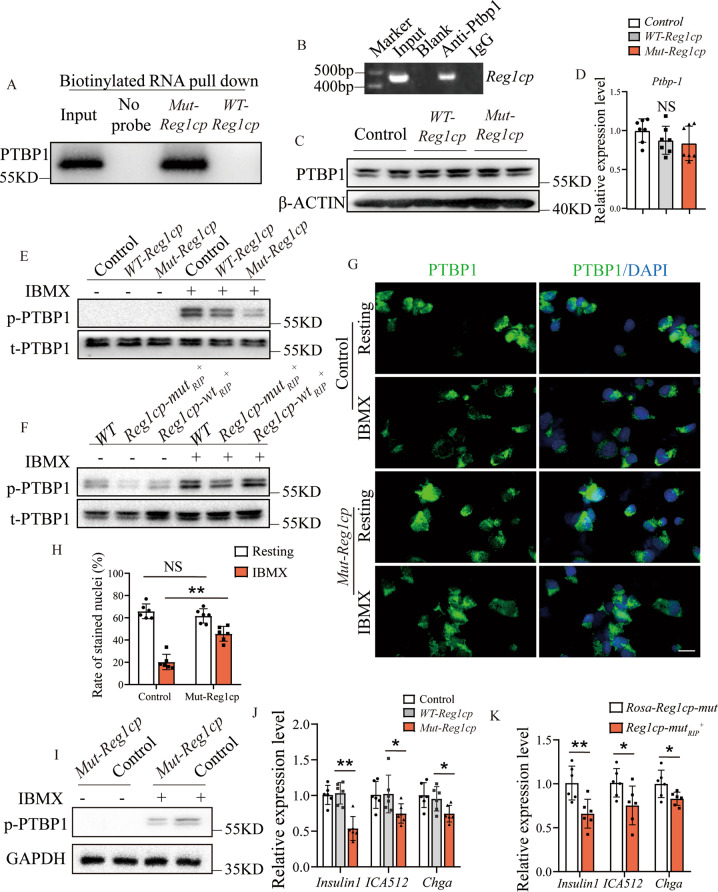
Fig. 4. Mut-Reg1cp impaired the insulin secretion by inhibiting phosphorylation of PTBP-1.
A Mut-Reg1cp retrieved PTBP1, as detected by immunoblotting. B Semi-quantitative PCR showed PTBP1 retrieved Mut-Reg1cp. C, D Western blot analysis of the expression of PTBP1 (C) and qRT-PCR analysis of Ptbp1 (D) in MIN6 cells transfected with Control, WT- Reg1cp or Mut-Reg1cp plasmids. E, F Western blot analysis of the expression of phosphorylation and total PTBP1 (p-PTBP1 and t-PTBP1) in MIN6 cells transfected with Control, WT- Reg1cp or Mut-Reg1cp plasmids (E) or in islets isolated from WT, Reg1cp-wtRIP+or Reg1cp-mutRIP+ mice (F) with or without IBMX treatment. G, H Representative immunostaining images of PTBP1 (green) and DAPI, nucleus (blue) (G) and quantification of PTBP1 positive nucleus (H) in MIN6 cells transfected with Control or Mut-Reg1cp plasmids before or after IBMX treatment. Scale bar: 20 μm. I Western blot analysis of the expression of p-PTBP1 in cytoplasm of MIN6 cells transfected with Control or Mut-Reg1cp plasmids with or without IBMX treatment. J RT-PCR analysis of Insulin, ICA512 and Chga in MIN6 cells transfected with Control, WT- Reg1cp or Mut-Reg1cp plasmids. K RT-PCR analysis of Insulin, ICA512 and Chga in islets isolated from Rosa-Reg1cp-mut or Reg1cp-mutRIP+ mice. A, B was representative of two independent experiments. In C–K, n = 6 in each group from two independent experiments. Data shown as mean ± SD. *P < 0.05; **P < 0.01; NS no significance; One-way ANOVA.

