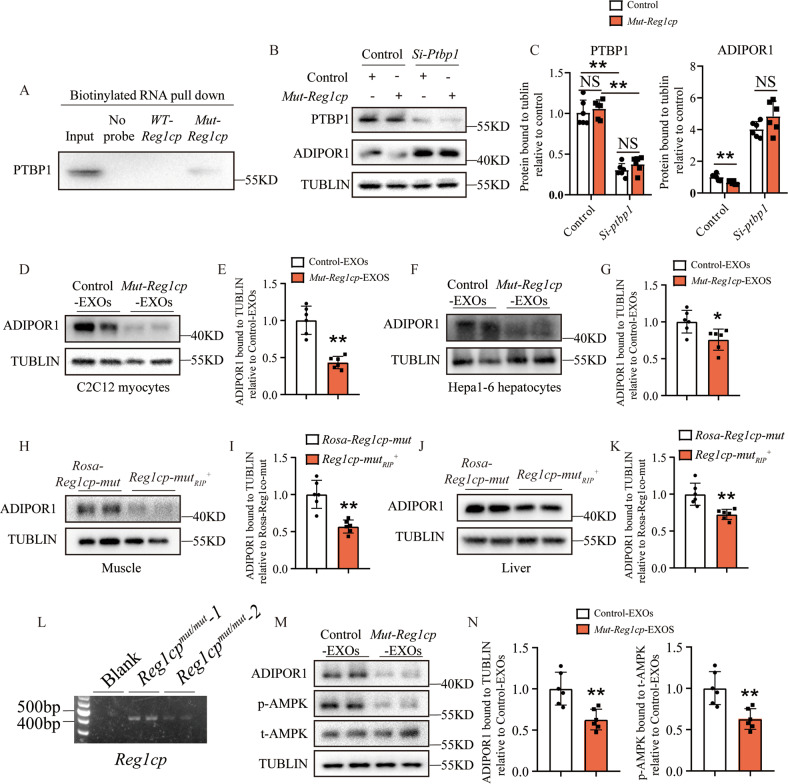
Fig. 7. Mut-Reg1cp promoted insulin resistance by inhibiting AdipoR1 translation.
A Mut-Reg1cp retrieved PTBP1, as detected by immunoblotting. B, C Representative pictures (B) and quantitative measurements (C) of western blot analysis of PTBP1 and ADIPOR1 level in C2C12 myocytes transfected with Mut-Reg1cp or control plasmids with or without si-Ptbp1 treatment. D, E Representative pictures (D) and quantitative measurements (E) of western blot analysis of ADIPOR1 level in C2C12 myocytes treated with exosomes contained Mut-Reg1cp or not. F, G Representative pictures (F) and quantitative measurements (G) of western blot analysis of ADIPOR1 level in Hepa1-6 hepatocytes treated with exosomes contained Mut-Reg1cp or not. H, I Representative pictures (H) and quantitative measurements (I) of western blot analysis of ADIPOR1 level in muscle of Reg1cp-mutRIP+ mice and Rosa-Reg1cp-mut controls. J, K Representative pictures (J) and quantitative measurements (K) of western blot analysis of ADIPOR1 level in liver of Reg1cp-mutRIP+ mice and Rosa-Reg1cp-mut controls. L Semi-quantitative PCR showed the expression level of Reg1cp in exosomes isolated from human serum. M, N Representative pictures (M) and quantitative measurements (N) of western blot analysis of ADIPOR1, p-AMPK and t-AMPK level in HepG2 hepatocytes treated with exosomes isolated from human serum. A and L were representative of two independent experiments. In B–K, M, N, n = 6 in each group from two independent experiments. Data shown as mean ± SD. *P < 0.05; **P < 0.01; NS no significance; Student’s t test for E, G, I, K, N. One-way ANOVA for C.

