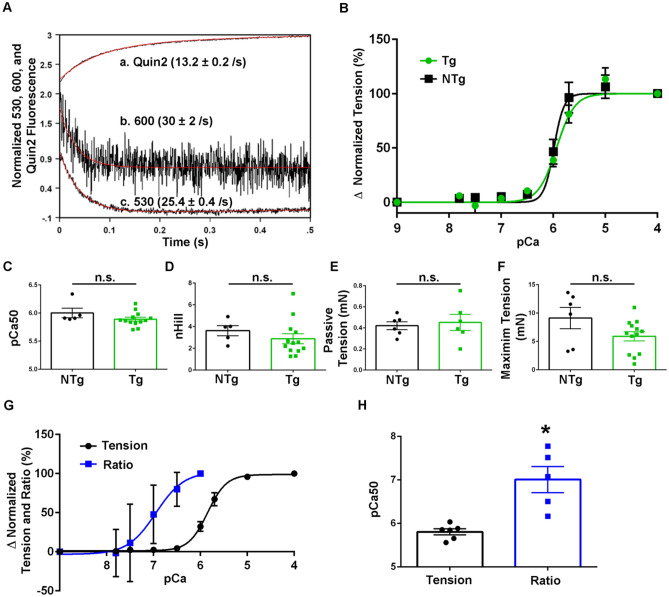
Figure 3.
Biochemical and steady-state biophysical analysis of TnC biosensor. (A) Calcium dissociation rates of the N-terminal of the control TnC peptide using Quin2 (a) and the N-terminal of the TnC-FRET peptide using 600 nm wavelength for mRuby2 (b) and 530 nm wavelength for Clover (c). (B) Relative tension developed as skinned EDL muscle was exposed to solutions of increasing calcium concentrations. Non-transgenic ([NTg, (n = 5 muscles from n = 3 animals)] and transgenic [Tg, (n = 8 muscles from n = 4 animals)] were used. Tension was normalized to the pCa 4.0 value obtained in each preparation. (C) Summary statistics of calcium concentration at half-maximal activation (pCa50) for NTg and Tg muscles showed no significant differences. (D) Summary statistics of the Hill coefficient value (nHill) for NTg and Tg muscles showed no significant differences. (E) Summary statistics of passive tension measurements for NTg and Tg muscles showed no significant differences. (F) Summary statistics of max relative tension measurements for NTg and Tg muscles showed no significant differences. (G) Combined graph of relative tension and fluorescence ratio changes as skinned EDL muscle exposed to solutions of increasing calcium concentration. Tension was normalized to the pCa 4.0 value obtained in each preparation (n = 6 muscle halves from n = 2 animals) and ratio fluorescence was normalized to the pCa 6.0 value obtained in each preparation (n = 5 muscle halves from n = 2 animals). (H) Summary statistics of calcium concentration at half-maximal activation (pCa50) for relative tension and FRET ratio fluorescence showed a significant difference in the pCa50 values. (P < 0.05). Mean ± S.E.M. data are presented.

