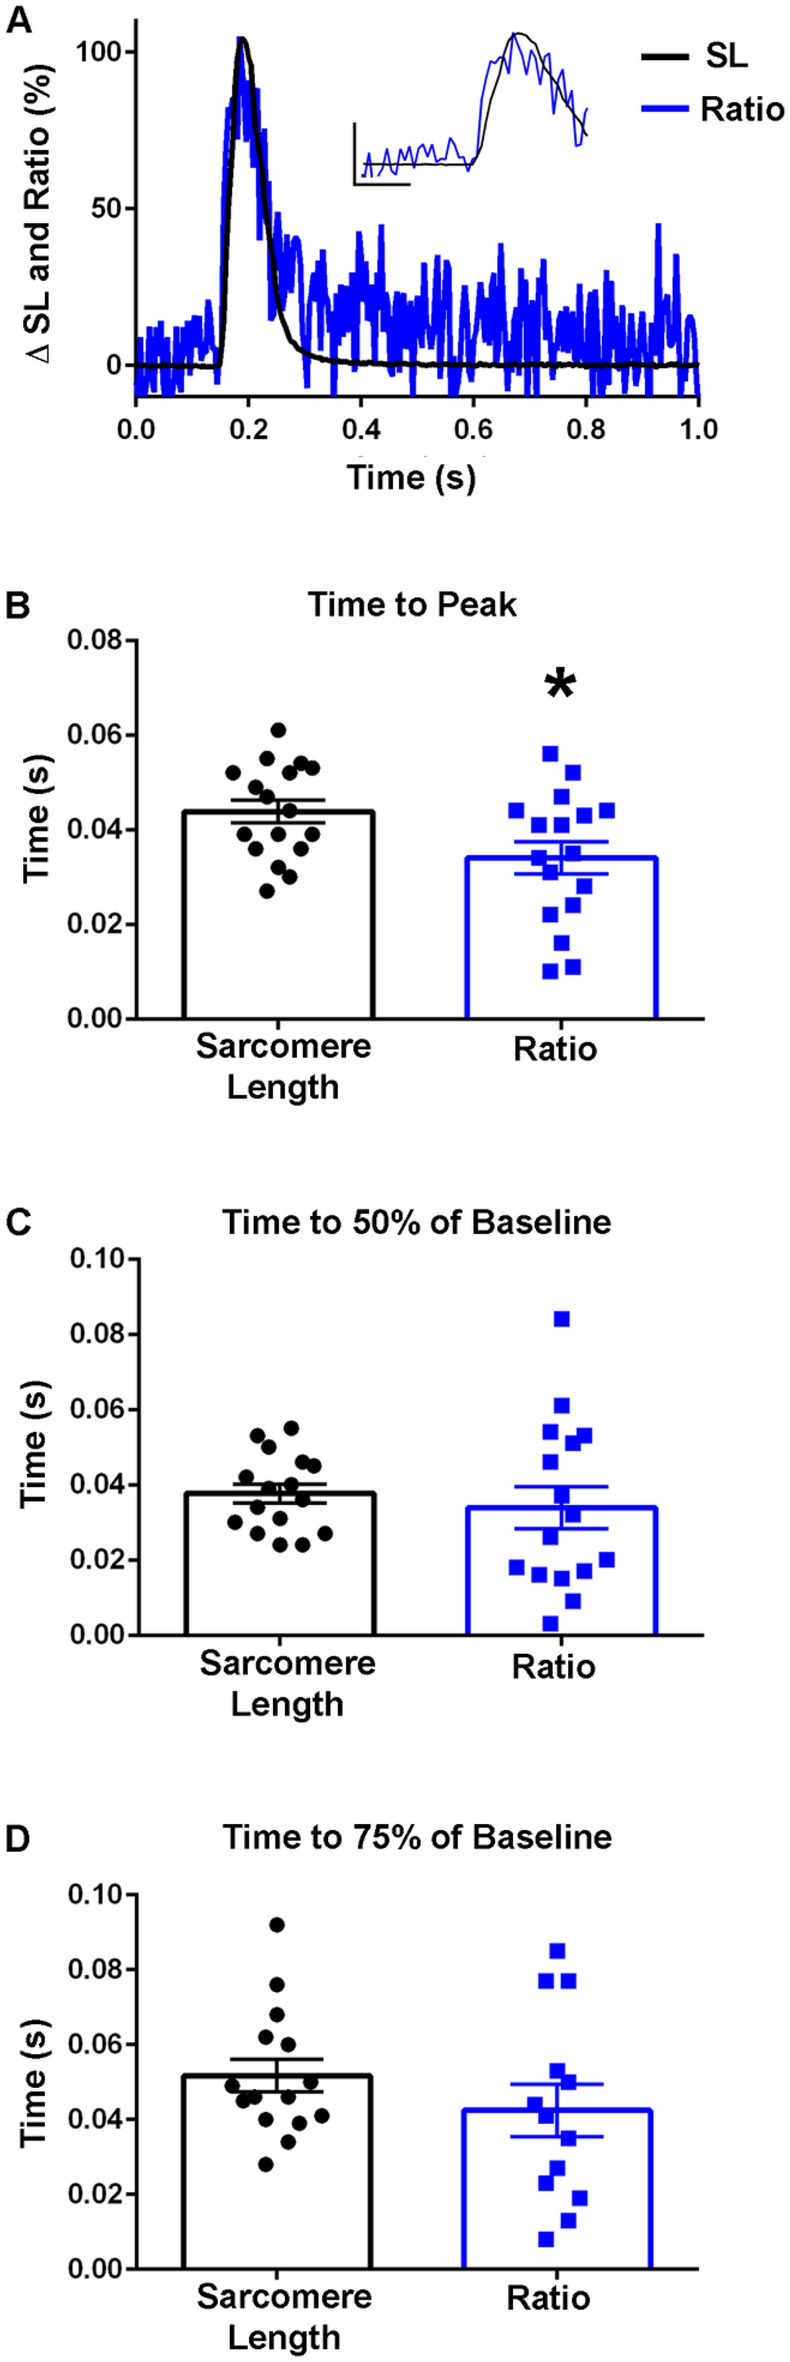
Figure 5.

TnC biosensor transient in unloaded intact FDB myofibers at room temperature. (A) Normalized traces (0–100%) of an ensemble average of biosensor ratio fluorescence (blue) and sarcomere length (black) dynamics which demonstrates the biosensor ratio transient peak precedes the peak of the sarcomere length transient. Inset shows same data and serves to highlight the differences of the peak timing (y-axis represents a 50% change from baseline, x-axis represents 0.10 s). (B) Summary statistics for time to peak for the biosensor ratio and sarcomere length indicate peak activation of the biosensor ratio (0.0341 ± 0.0034 s) occurred significantly before the peak sarcomere length change (0.0438 ± 0.0024) s (n = 17 myofibers from 11 animals in each group). (C) Summary statistics for the time to 50% of baseline for the biosensor ratio and sarcomere length demonstrated no significant difference between the ratio or sarcomere length (n = 16 myofibers from n = 11 animals in each group). (D) Summary statistics for the time to 75% of baseline for the biosensor fluorescence ratio and sarcomere length changes showed no significant difference in the relaxation dynamics of the biosensor and sarcomere length (Sarcomere length: n = 15, Ratio: n = 13 from n = 9 animals). Myofibers measured at room temperature with 0.2 Hz stimulation. Mean ± S.E.M. are presented, *P < 0.05.
