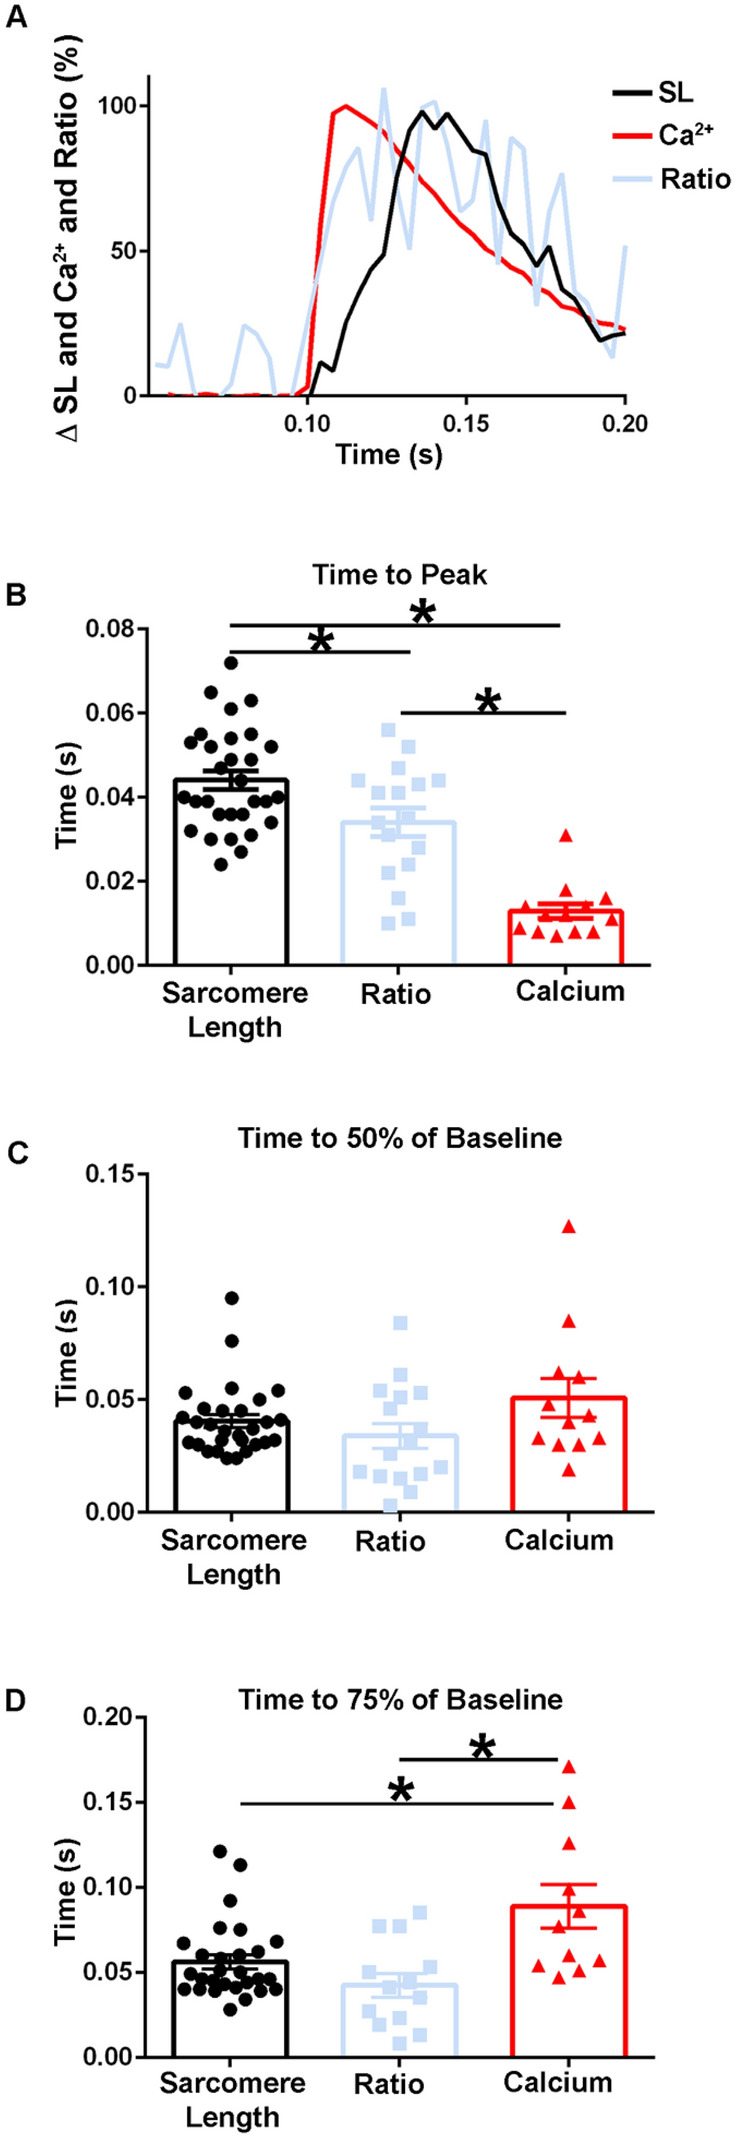
Figure 9.

Temporal alignment of sarcomere length, TnC biosensor transient, and calcium transient kinetics during a twitch at room temperature. (A) Normalized traces (0–100%) of an ensemble average of FURA-2 calcium fluorescence (red), biosensor ratio fluorescence (blue), and sarcomere length (black) dynamics. This figure is a graphic compilation of data shown in Figs. 6 and 8. (B) Summary statistics of the time to peak amplitude for sarcomere length, biosensor transient, and calcium transient shows the time to peak of the biosensor significantly precedes that of the sarcomere length, and the time to peak of calcium is reached before both the biosensor transient and sarcomere length (Sarcomere length: n = 30 myofibers from n = 14 animals, Ratio: n = 17 myofibers from n = 11 animals, FURA-2: n = 13 myofibers from n = 3 animals). (C) Summary statistics of the time to 50% of baseline for sarcomere length, biosensor ratio transient, and the calcium transient (Sarcomere length: n = 29 myofibers from n = 14 animals, Ratio: n = 16 myofibers from n = 11 animals, FURA-2: n = 12 myofibers from n = 3 animals). (D) Summary statistics for the time to 75% of baseline for sarcomere length, biosensor ratio transient, and calcium transient shows the calcium decay transient is significantly slower than both the relaxation of sarcomere length and the biosensor transient inactivation. (Sarcomere length: n = 29 myofibers from n = 14 animals, Ratio: n = 16 myofibers from n = 11 animals, FURA-2: n = 12 myofibers from n = 3 animals). Myofibers measured at room temperature with 0.2 Hz stimulation. Mean ± S.E.M. are presented, *P < 0.05.
