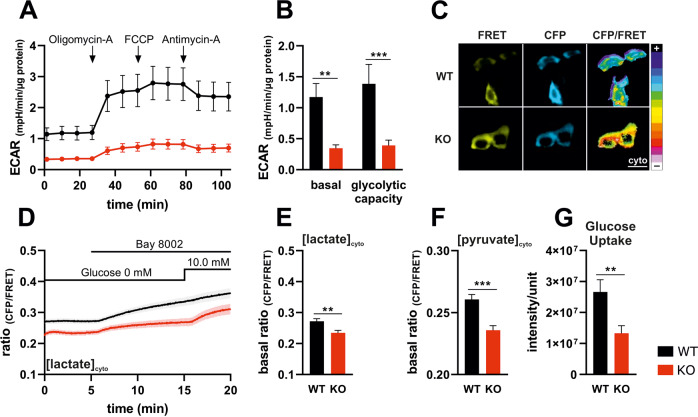
Fig. 1. IK deficiency impairs glycolytic activity.
A Extracellular acidification rates (ECAR) of MMTV-PyMT WT (black line and circles) and MMTV-PyMT IK KO cells (red line and circles) over-time in response to administration of Oligomycin-A, FCCP, or Antimycin-A as indicated in the panel. Data represents average ±SEM of n = 3 independent experiments per genotype. B Basal ECAR (timepoints 0–30, left) and glycolytic capacity (right) of MMTV-PyMT WT (black bars) and MMTV-PyMT IK KO cells (red bars). Bars represent average ±SEM, n = 3 with **p ≤ 0.01 and ***p ≤ 0.001, unpaired t-test. C Representative FRET (yellow, left), CFP (cyan, middle) and pseudocoloured FRET-ratio images (16-colors, right) and D FRET-ratio signals over-time of MMTV-PyMT WT (black) and MMTV-PyMT IK KO cells (red) expressing Laconic, a FRET-based lactate indicator ([lactate]cyto). At time point indicated in the panel, either the MCT-inhibitor BAY-8002 or 10.0 mM of glucose were administered to the cells. Data represents average ±SEM, n = 5. Scalebar = 20 µm. E Basal FRET-ratio signals (timepoints 0–5 in D) of MMTV-PyMT WT (black bar) and MMTV-PyMT IK KO cells (red bar) expressing the FRET-based lactate indicator. Bars represent average ±SEM, n = 5 with **p ≤ 0.01, unpaired t-test. F Basal FRET-ratio signals (timepoints 0–5) of MMTV-PyMT WT (black bar) and MMTV-PyMT IK KO cells (red bar) expressing Pyronic, a FRET-based pyruvate indicator ([pyruvate]cyto). Bars represent average ±SEM, n = 5 (WT), 6 (KO) with ***p ≤ 0.001, unpaired t-test. G Glucose uptake rates of MMTV-PyMT WT (black bar) and IK KO cells (red bar), analyzed using 2-NBDG, a fluorescent glucose analog. Data represent average ±SEM from n = 5 independent experiments per genotype.

