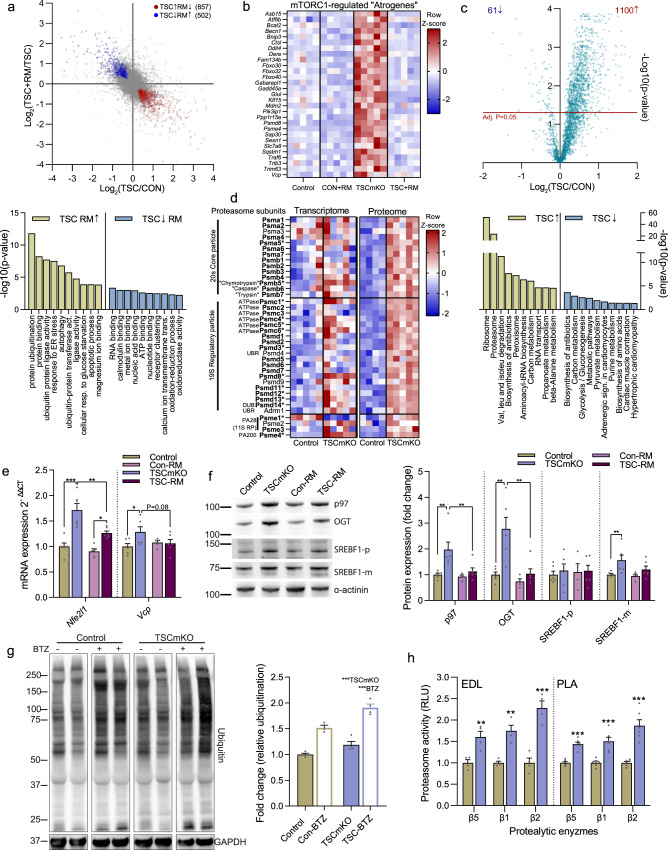
Fig. 1. Skeletal muscle mTORC1 hyperactivity upregulates the ubiquitin proteasome system.
a Pairwise comparison of muscle mTORC1 activation- (TSC/CON) and subsequent rapamycin inhibition-induced (TSC+RM/TSC) gene expression changes in EDL muscle with mTORC1-regulated genes up- (red) and downregulated (blue) in TSCmKO mice and counter-regulated by rapamycin as denoted. Top Gene Ontology (GO) terms are presented below (n = 5 per group). b Heatmap of changes in the expression of mTORC1-regulated “atrogenes”. c Volcano plot for changes in protein expression between TSCmKO and control TA muscle with top GO terms associated with significantly increased and decreased proteins below (n = 4–5 per group). d Heatmap of changes in gene and protein expression for control and TSCmKO mice of all expressed 26S proteasome subunits and members of the PA28 and PA200 proteasome activators. e mRNA and f protein expression of Nrf1 regulators, as measured by RT-qPCR (gastrocnemius) and Western blot (tibialis anterior), respectively (n = 4–6 per group). g Representative blots and quantification of mono- and poly-ubiquitinated proteins in control and TSCmKO mice treated with vehicle or 1 mg.kg−1 of the proteasome inhibitor Bortezomib (BTZ) 12–16 h before dissection (n = 3–4). h Luciferase-based peptidase activity of 20S proteasome catalytic enzymes in extensor digitorum longus (EDL; n = 4) and plantaris (PLA; n = 6) muscle. Actb was used as the reference gene (e) and either α-actinin (f) or GAPDH (g) was used as the protein loading control. Data are presented as mean ± SEM. Two-tailed Student’s t-tests (h) or two-way ANOVAs with Sidak post hoc tests were used to compare the data. *, **, and *** denote a significant difference between groups of P < 0.05, P < 0.01, and P < 0.001, respectively. For trends, where 0.05 < P < 0.10, p values are reported.

