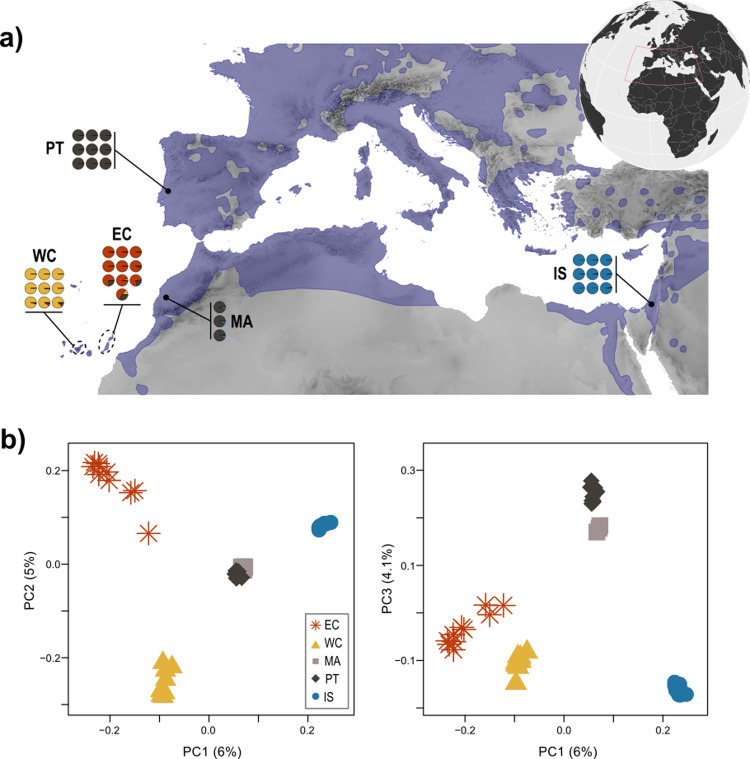
Fig. 1. Population structure of barn owls from the Mediterranean Basin and the Canary Islands.
a Individual admixture proportion of each of K = 4 lineages as determined by sNMF. Black dots are located at the approximate centroid of each sampled population. Dashed lines encircle the island(s) sampled for each Canary population. The current distribution of barn owls is plotted atop the map in blue (data from IUCN: BirdLife International 2019). b PCA of the 40 individuals. Principal component (axes) one and two (left panel) and one and three (right panel) are shown, values in parenthesis indicate the percentage of variance explained by each axis. Point shape and colour denote populations according to the legend.

