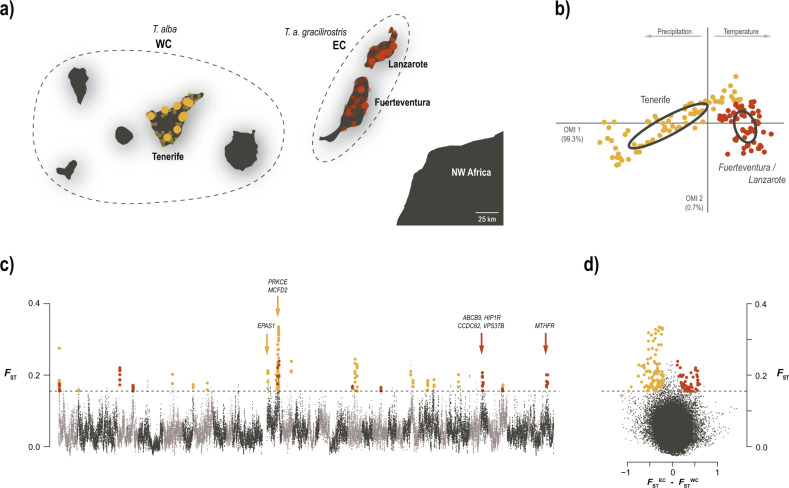
Fig. 3. Ecological divergence in barn owls from the Canary Islands.
a Sampling location of Western (WC; yellow) and Eastern (EC; red) Canary individuals, off the coast of north-western Africa. Sampled islands are named. Large dots indicate individuals sampled for WGS and population genomics analyses; small transparent dots are barn owl observations used in niche analysis. Dashed lines group islands according to barn owl taxonomy. b Climatic niche occupied by the two Canary populations. The first axis varies from cold and wet to hot arid environments. c Genome-wide FST comparison between individuals from each Canary population. Each dot represents a 100kbp window. Alternating grey colours denote different chromosomes. Dashed line indicates the 5 SD FST threshold used to identify genomic regions of high differentiation overlaid with FSTWC, highlighted in yellow and FSTEC in red. Arrows denote the location of genes linked with response to hypoxia in WC; and the cluster of four genes linked to morphological ratios and the main gene related to blood pressure in EC. d Same FST windows and threshold as in c plotted against the difference between FSTWC and FSTEC, clearly highlight the two sets of windows putatively under local adaptation.

