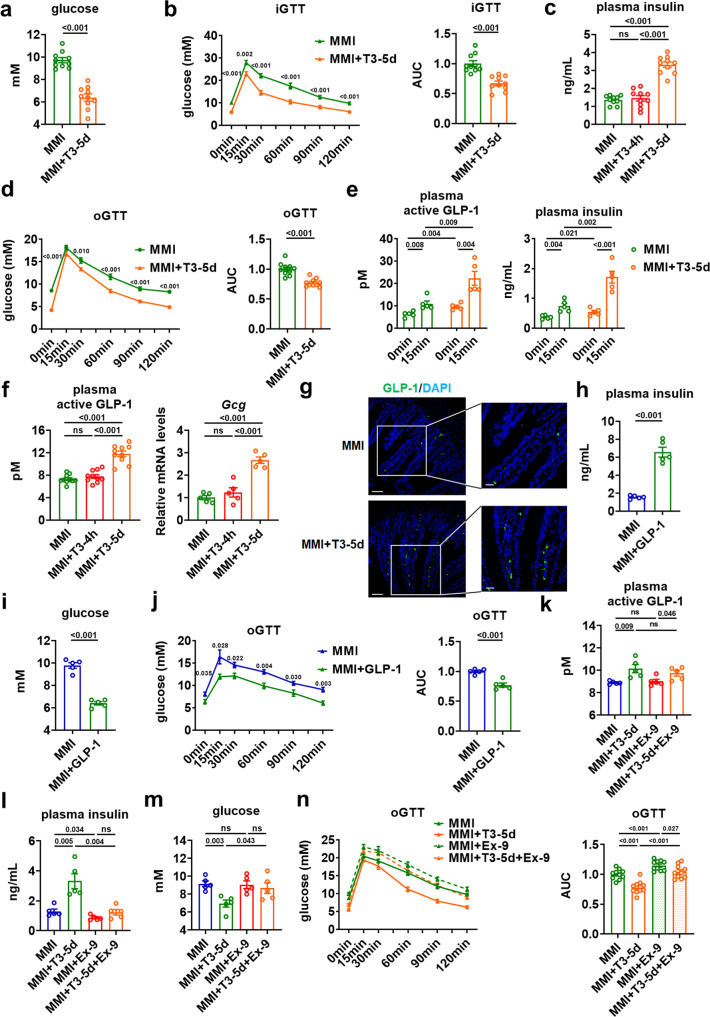
Fig. 1. GLP-1 mediates the insulinotropic and glucose-lowering effects of T3.
a Blood glucose levels in MMI and MMI + T3-5d mice (n = 10). b iGTT for MMI and MMI + T3-5d mice (left) and the AUC (right) (n = 10). c Plasma insulin levels in MMI, MMI + T3-4h and MMI + T3-5d mice (n = 10). d oGTT for MMI and MMI + T3-5d mice (left) and the AUC (right) (n = 10). e Plasma active GLP-1 (left) and plasma insulin (right) levels in fasted MMI and MMI + T3-5d mice after oral glucose challenge (n = 5). f Plasma active GLP-1 (n = 10) and relative Gcg mRNA levels in the ileum (n = 5) of MMI, MMI + T3-4h and MMI + T3-5d mice. g Representative IF staining of ileal GLP-1 (green) and DAPI staining (blue) in MMI and MMI + T3-5d mice. Scale bar (original: 50 μm; enlarged: 20 μm). h, i Plasma insulin (h) and blood glucose levels (i) in MMI mice and MMI mice treated with GLP-1 for 5 days (n = 5). j oGTT for MMI mice and MMI mice treated with GLP-1 for 5 days (left) and the AUC for oGTT (right) (n = 5). k–m Plasma active GLP-1 (k), plasma insulin (l), and blood glucose (m) levels in MMI and MMI + T3-5d mice treated with Ex-9 for 5 days (n = 5). n oGTT for MMI and MMI + T3-5d mice treated with Ex-9 for 5 days and the AUC (right) (n = 10). iGTT intraperitoneal GTT, oGTT oral GTT. Means ± SEM are shown. P values were calculated by two-tailed unpaired Student’s t test. ns not significant. Source data are provided as a Source Data file.

