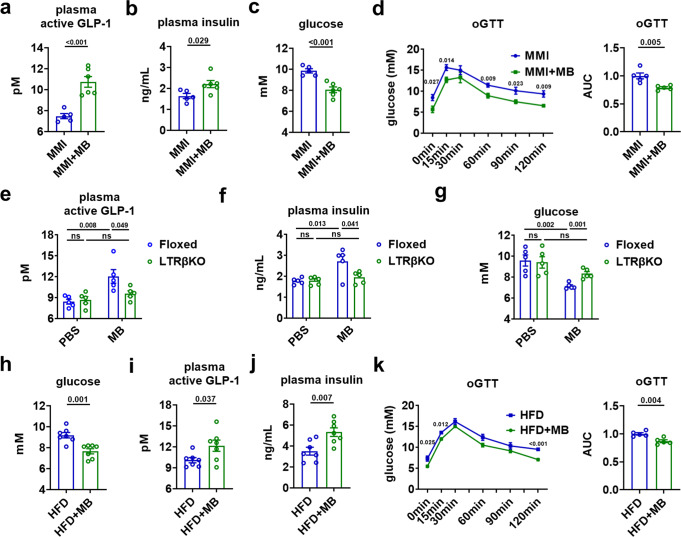
Fig. 3. Pharmacological activation of the hepatic TRβ potentiates the GLP-1 production.
a–c Plasma active GLP-1 (a), plasma insulin (b), and blood glucose (c) levels in MMI mice and MMI mice treated with MB for 5 days (n = 5–6). d oGTT for MMI mice and MMI mice treated with MB for 5 days (left) and the AUC for oGTT (right) (n = 5). e–g Plasma active GLP-1 (e), plasma insulin (f), and blood glucose (g) levels in Floxed and LTRβKO mice treated with PBS or MB for 5 days as indicated (n = 5). h–j Blood glucose (h), plasma active GLP-1 (i), and plasma insulin (j) levels in HFD mice treated with or without MB for 14 days (n = 7). k oGTT for HFD treated with or without MB for 14 days (left) and the AUC for oGTT (right) (n = 5). oGTT, oral GTT. Means ± SEM are shown. P values were calculated by two-tailed unpaired Student’s t test. ns not significant. Source data are provided as a Source Data file.

