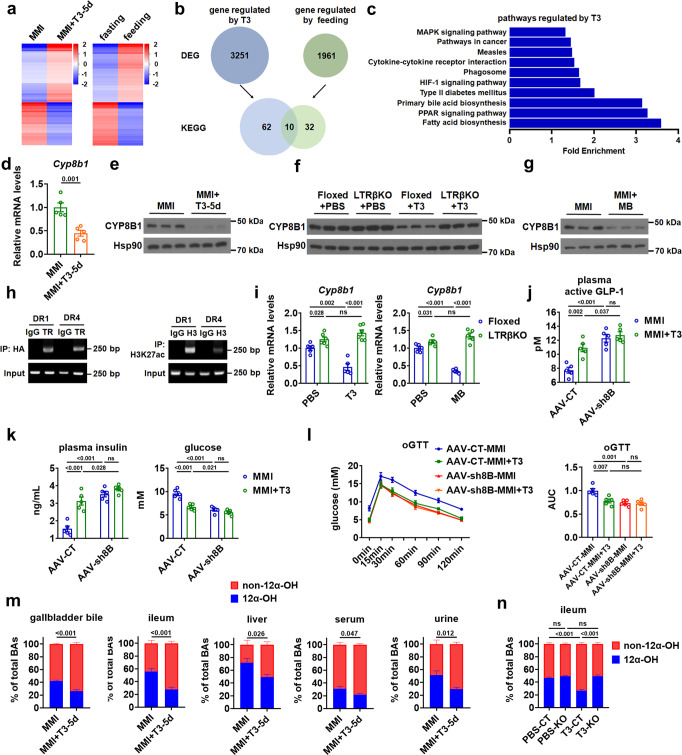
Fig. 4. TH shapes the BA composition by targeting CYP8B1 in the liver.
a Heatmaps of all DEGs identified by RNA-seq analysis in the liver of MMI mice treated with T3 for 5 days (left, n = 3) and microarray analysis in the liver of mice upon feeding (right, n = 3). b KEGG analysis of these DEGs in response to T3 treatment and food ingestion, respectively. Venn diagram illustrating commonalities and differences in enriched KEGG pathways regulated by T3 and feeding. c KEGG pathways regulated by T3, which are also regulated by feeding, are ranked by fold enrichment. d, e Relative mRNA levels (d, n = 5) and western blot analysis (e, n = 3) of CYP8B1 in the liver of MMI and MMI + T3-5d mice. f Western blot analysis of CYP8B1 in the liver of Floxed and LTRβKO mice treated with PBS or T3 for 5 days (n = 3). g Western blot analysis of CYP8B1 in the liver of MMI mice and MMI mice treated with MB for 5 days (n = 3). h ChIP-PCR analysis of HA-TRβ recruitment (left) and H3K27 acetylation (right) in the predicted super-enhancer region containing two putative TRβ binding sites (DR1 and DR4) in primary hepatocytes. i Relative mRNA levels of Cyp8b1 in the liver of Floxed and LTRβKO mice treated with T3 (left) or MB (right) for 5 days (n = 5–6). j, k Plasma active GLP-1 (j), plasma insulin and blood glucose levels (k) in MMI and MMI + T3-5d mice administered with AAV-CT or AAV-shCyp8b1 (AAV-sh8B) (n = 5). l oGTT for MMI and MMI + T3-5d mice administered with AAV-CT or AAV-sh8B (left) and the AUC for oGTT (right) (n = 5). m Relative levels of 12α-OH (blue) and non-12α-OH (red) BAs in the gallbladder bile, ileum, liver, serum, and urine of MMI mice and MMI + T3-5d mice (n = 5). n Relative levels of 12α-OH (blue) and non-12α-OH (red) BAs in the ileum of Floxed and LTRβKO mice treated with PBS or T3 for 5 days (n = 5). oGTT oral GTT. Means ± SEM are shown. P values were calculated by two-tailed unpaired Student’s t test. ns not significant. Source data are provided as a Source Data file.

