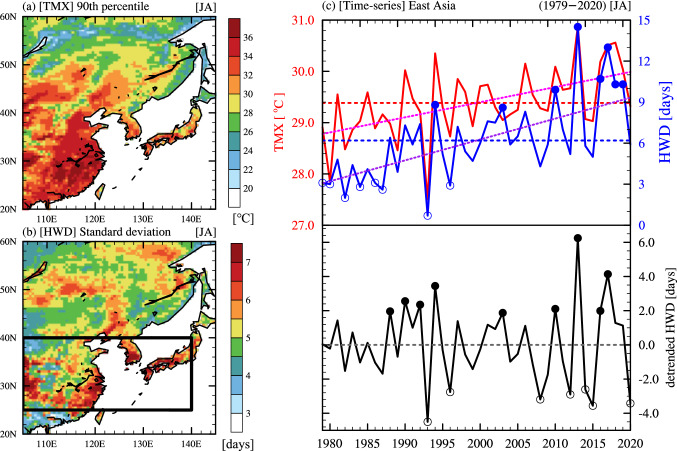
Figure 1.
Climatological features of maximum temperature (TMX) and heatwave days (HWD) in East Asia. (a) 90th percentile of daily TMX (unit: °C) (1979–2020) in peak summer (July–August), and (b) standard deviation of HWD (unit: days). The black rectangle indicates the area of interest in East Asia where the standard deviations of HWD are high. (c) Time series of TMX (red solid line), HWD (blue solid line), and detrended HWD (black solid line) in the black rectangle area in (b). The open and closed circles indicate heatwave years in East Asia (HWY-EA) and non-heatwave years in East Asia (NHWY-EA), identified from the HWD with the trend (blue) and detrended HWD (black), respectively. The horizontal dashed lines indicate the climatological mean and the pink and purple dotted lines indicate the trends.

