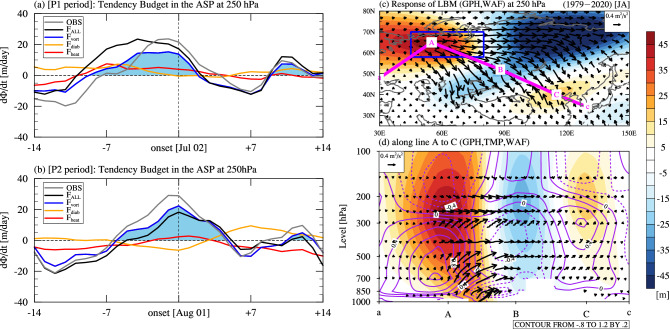
Figure 4.
Quasi-geostrophic geopotential tendency (QG tendency) budget analysis and model experiments. Time series of the 7-day running mean QG tendency budget (units: m/day) in the ASP at 250 hPa for (a) P1 and (b) P2 periods. The solid gray line indicates the geopotential height (GPH) tendency obtained from reanalysis data. Black, red, orange, and solid blue lines indicate the QG tendency budget induced by the total forcing (FALL), temperature advection (Fheat), diabatic heating (Fdiab), and vorticity forcing (Fvort), respectively. The shading in (a) and (b) indicates a positive vorticity forcing period. (c and d) Same as in Fig. 3a and b but for the atmospheric responses to the vorticity tendency and diabatic heating (Q1) forcings in the linear baroclinic model (LBM) experiment. These steady forcings in the LBM are derived from the daily relative vorticity tendency and Q1 over the Arctic-Siberian Plain (ASP) region from the surface level to 10 hPa with a temporal average from days − 3 to 0 (onset) during the P1 and P2 periods in (a) and (b).

