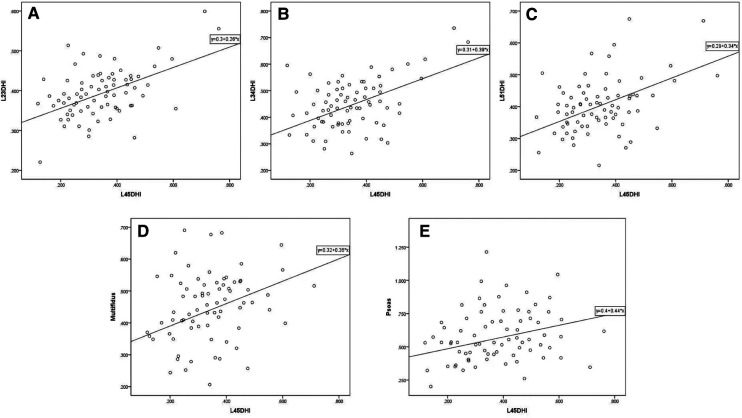
Figure 7.
Scatter plot of L4/5 DHI and other imaging parameters in DLS group. (A, B, C) L4/5 DHI showed significant positive correlations with L2/3 DHI (r = 0.470, P < 0.05), L3/4 DHI (r = 0.529, P < 0.05), and L5/S1 DHI (r = 0.463, P < 0.05) in the DLS group. (D, E) L4/5 DHI showed significant positive correlations with the RCSA of the multifidus muscle (r = 0.390, P < 0.05) and psoas major muscle (r = 0.294, P < 0.05). DHI: disc height index, Multifidus: relative cross-sectional area of multifidus muscle, Psoas: relative cross-sectional area of psoas major muscle.

