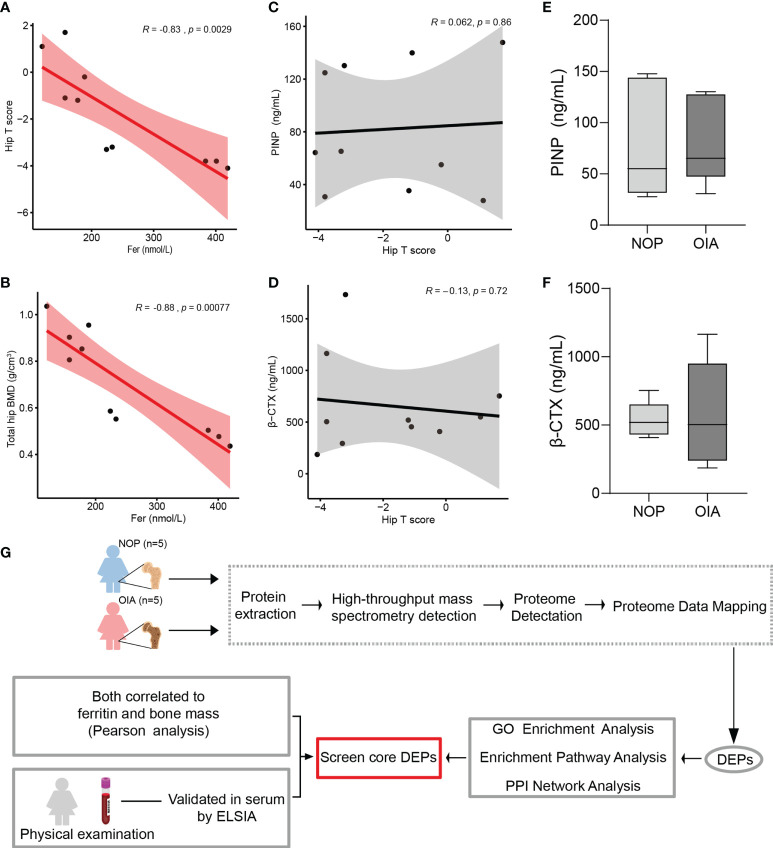
Figure 1.
Correlation analysis of clinical index, proteomic analysis workflow. (A) Pearson correlation analysis of hip T score and serum ferritin. (B) Pearson correlation analysis of total hip bone mineral density and serum ferritin. (C) Pearson correlation analysis of serum PINP and hip T score. (D) Pearson correlation analysis of serum β-CTX and hip T score. (E) Serum PINP level of patients from Group NOP and OIA. (F) Serum β-CTX level of patients from Group NOP and OIA. (G) Workflow for quantitative mass spectrometry profiling.

