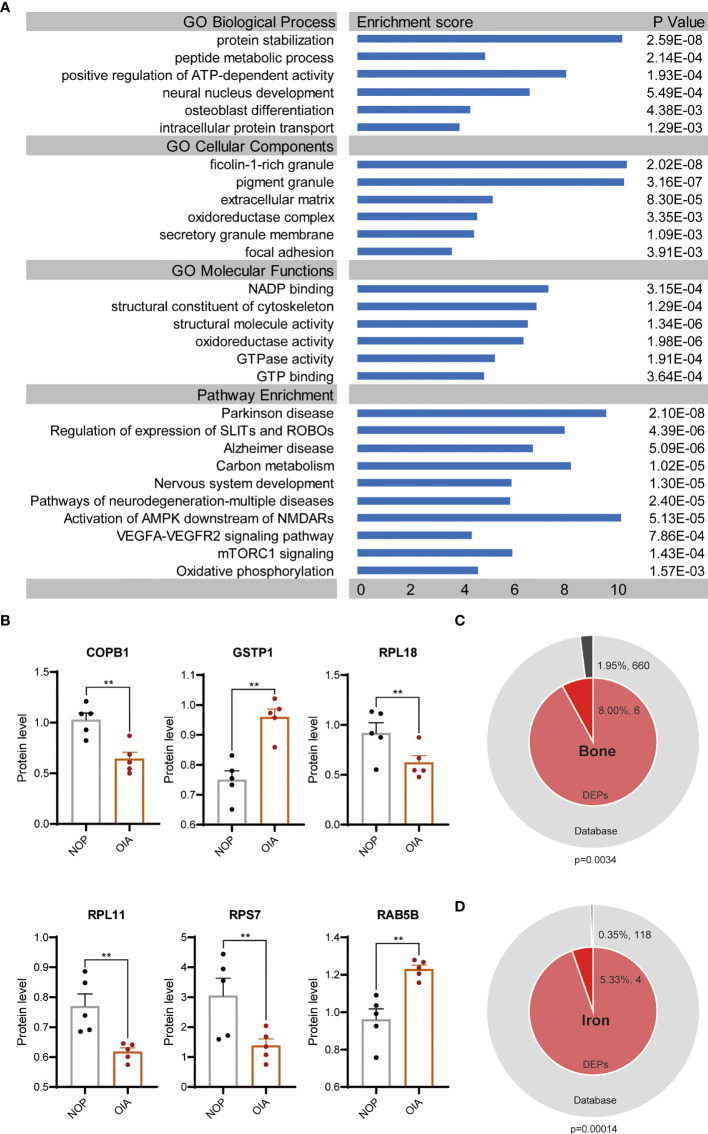
Figure 3.
GO terms and pathway enrichment analyses of DEPs between OIA and NOP samples. (A) GO and pathway analysis of the 75 DEPS. (B) Changes in 6 top enriched proteins of GO terms in the osteoporosis with iron accumulation. (C) Membership analysis of DEPs associated with bone metabolism. (D) Membership analysis of DEPs associated with iron metabolism. **P<0.01.

