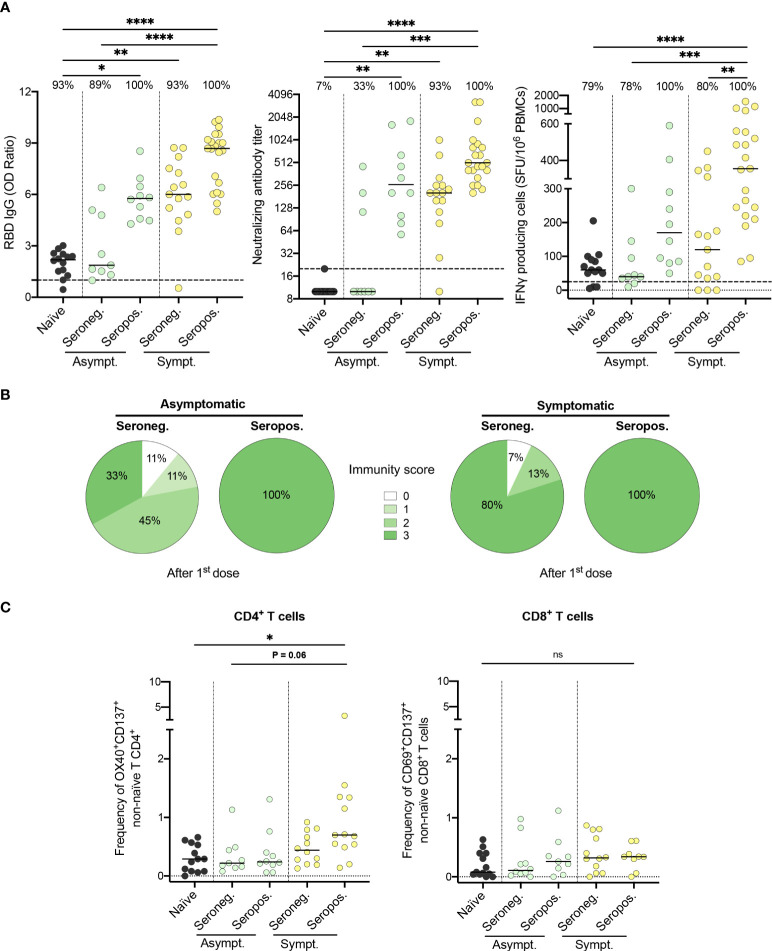
Figure 4.
Both symptomatology during infection and serostatus prior to vaccination influence the immunogenicity of the first vaccine dose. (A) SARS-CoV-2 Spike RBD–specific binding IgG levels assessed by ELISA (left panel), SARS-CoV-2 neutralizing antibody titers (middle panel), and IFN-γ secreting cells per million in response to SARS-CoV-2 Spike glycoprotein peptides assessed by ELISpot (right panel) for naïve (black circles), seronegative (Seroneg.) (n=24) and seropositive (Seropos.) (n=31) recovered HCWs after one dose of vaccine. Asymptomatic recovered HCWs (Asympt.) are represented with green circles (n=19) and symptomatic HCWs (Sympt.) with yellow circles (n=36). Dashed black lines indicate the positive threshold value, and the percentage of HCWs with responses above positive threshold value is indicated for each assay. (B) Pie charts of calculated immunity score for asymptomatic (left panel) and symptomatic (right panel) recovered HCWs after one dose of vaccine. (C) Frequency of SARS-CoV-2−Spike-specific T cells measured as percentage of OX40+CD137+ non-naïve CD4+ (left panel) and CD69+CD137+ non-naïve CD8+ T cells (right panel) after stimulation of PBMCs with CD4-S mega pool of peptides from the Spike glycoprotein for naïve (n=13), asymptomatic seronegative (n=9) or seropositive (n=10) and symptomatic seronegative (n=12) or seropositive (n=13) recovered HCWs after one dose of vaccine. Horizontal bars indicate the median of each group. Kruskal-Wallis tests assessed statistical significance (A-C). Not significant (ns) P >.05; *P < .05; **P <.01; ***P < .001; ****P < .0001.

